

Tableau has just dropped its full release of 2020.1 across the whole product suite and this means some exciting new features for Tableau Prep! These are of course the ability to use level of detail (LOD) calculations and to apply rank calculations (analytic calculations) to your data (as demoed by the devs at TC19). These additions have been highly sought after for a long time and the new techniques are most definitely going to save the prep community time and effort. In previous versions of Prep Builder, you would have to build some fun workarounds to achieve the same result, now we have a great new visual interface to build our calculations.
Before diving into the new methods to utilise LODs and rank in the flow, I’m going to recap how to build the workarounds in previous versions for the benefit of those who may not have the luxury of 2020.1.
2019.4 and earlier
LODs
The simpler of the two workarounds. All an LOD is doing is aggregating our data to a particular level of detail. For example, in our superstore data, the data is recorded at most granular level which is an order line (product within an order). We might actually want to have a field which is the sum of all our sales for each sub-category.
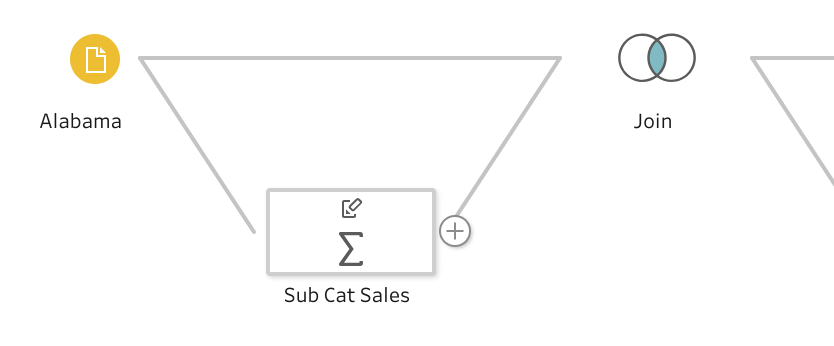
To achieve this in Tableau Prep 2019.4 and earlier, we would first have to aggregate the data to the level we desire, in this case summing the sales for each sub-category. We would then have to join the aggregation back to the original data on the sub-category field.
Nothing too complexed, however, this is not as simple as the technique many are used to in Tableau Desktop in which they just create a LOD calculated field. In this case it would read:
{FIXED [Sub-Category] : SUM([Sales])}
Rank
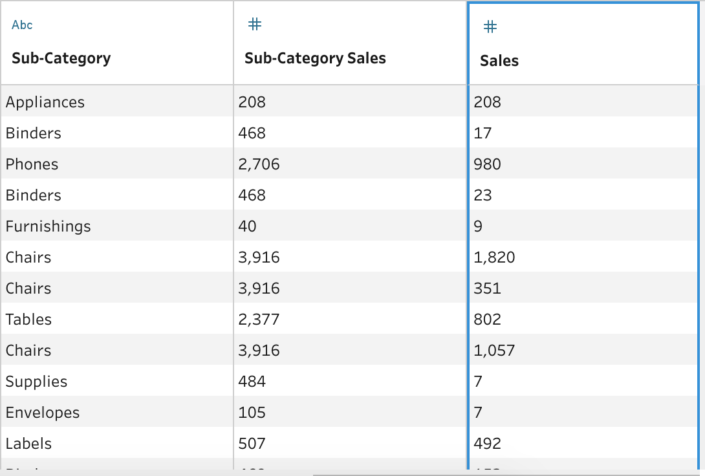
Now we have our sales for each sub-category, perhaps we would like to add a rank to our data. The first step that needs to be taken is to perform a self join on our sub-category sales.
The join condition to use (for a descending rank) is sub-category sales <= sub-category sales. This means our highest sub-category sales will only join to itself, number two rank will join to itself and number one rank and so on.
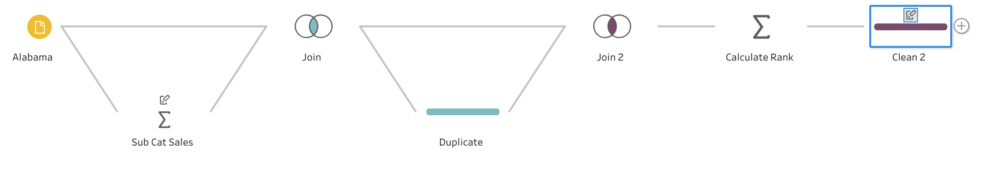
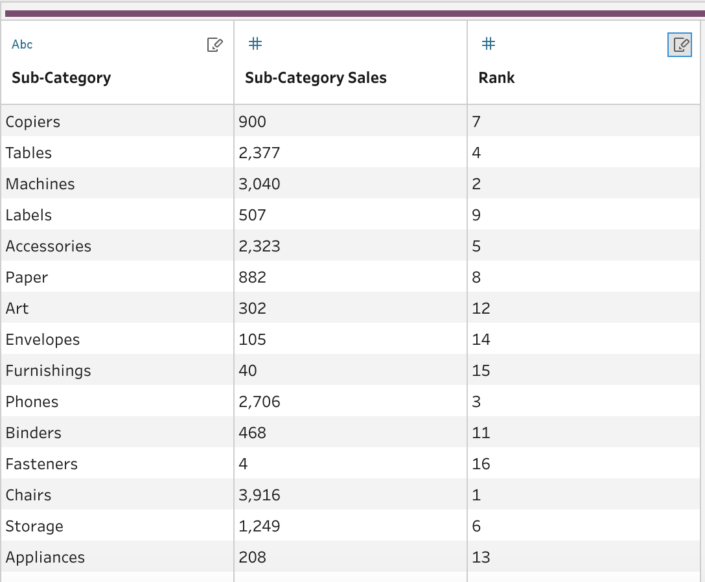
Following our join we need to perform an aggregation. We’ll group by sub-category and our original sub-category sales, and perform a count distinct on our duplicate sub-category sales. This will count the number of other distinct sales rows that our original joined to and therefore provide us with our rank. I.e. our lowest rank sub-cat sales should have joined to every other sub-cat sales. Note that this technique will give you a modified competition rank, i.e. scores of 10, 9, 9, 8 would give you a rank of 1, 3, 3, 4.
Finally the ranked data can be joined to the original data. Although we now have a ranked field, it won’t actually sort the data in this order. It is possible to generate the field, but it becomes a bit of a long winded process. Why don’t we check out what’s new in 2020.1…
2020.1
There are two methods to performing rank and LOD calculations in Tableau Prep now. One is the new fancy visual method and the other is old school typed calculations. I’m going to talk through both.
Visual calculation window
This new calculation window was demoed at TC19 and in my opinion is a very nice addition to Tableau Prep. It makes it very clear to understand exactly what you’re calculating / ranking. I think many people will naturally continue to just type their LODs manually, but for someone who is new to Tableau and is not very familiar with the calculations in desktop it makes everything much clearer to understand.
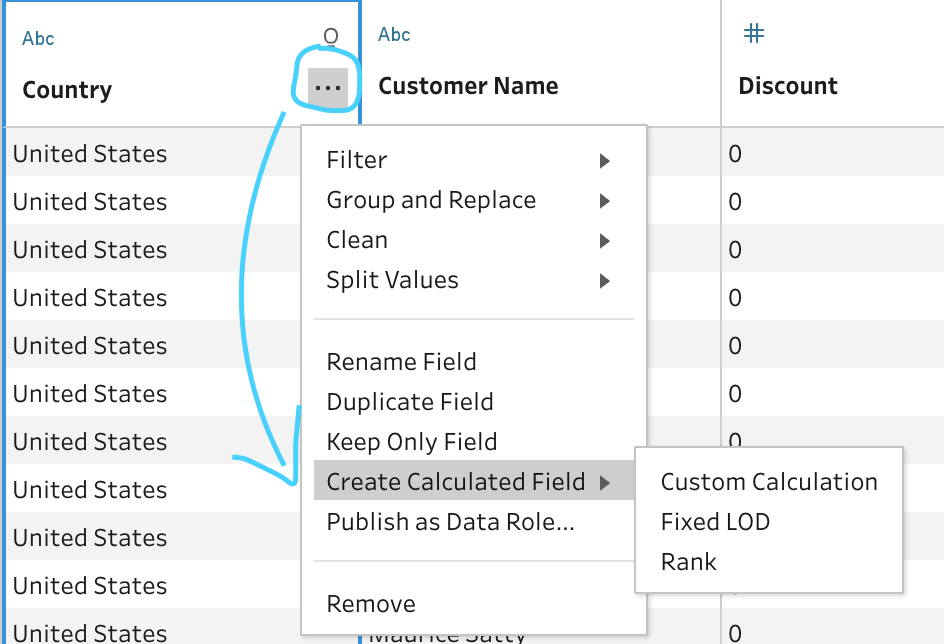
To bring up the visual calculation window, go to the field you want to aggregate / rank and select the three dots. In the menu you will now see three options pop out under calculated field: custom calculation, fixed LOD and rank.
LOD
Once the calculation window has popped up, you’ll notice at the top there is a drop down which allows you to flip between a fixed LOD and a rank, you don’t have to come in and out of the window again which is neat.
First we want to select our category to group by from the drop down, in this case this is sub-category. Next we select our method of aggregation, in this case sum. And there you have it, a fixed LOD.
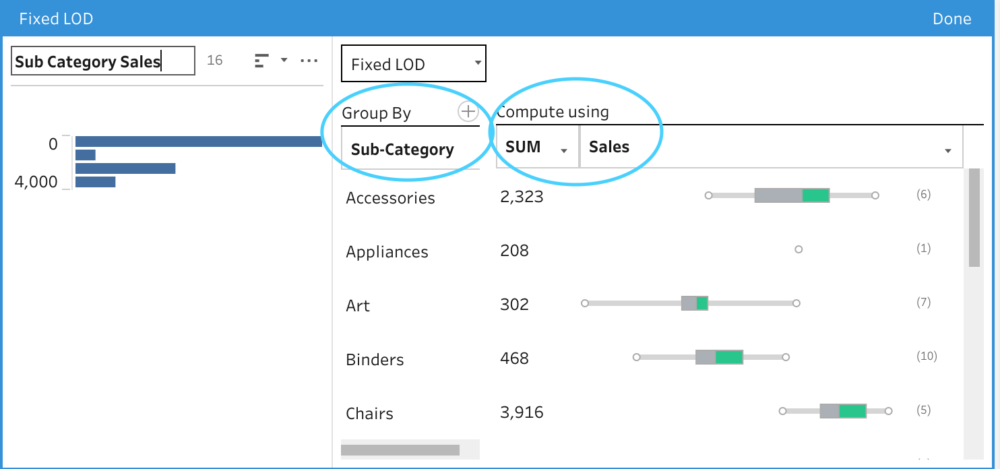
I really like this new calculation window as it provides you with some additional insights to your data. You get a view of the distribution of the data that can’t be seen anywhere else in Prep, quickly showing the min, max and median values. The quartiles are also included in this view. Once you start adding fields you want to group by, these distributions will breakdown accordingly.
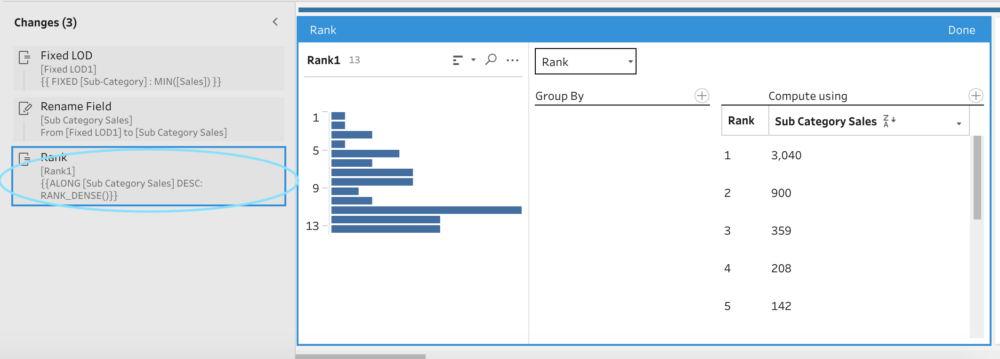
In the changes panel, you can also see your LOD being built out in the standard calculation syntax which you may be used to in Tableau Desktop. Interestingly, if you go to edit this calculation, it will bring up the visual window. However, if you have manually typed an LOD calculation and you go to edit it, it will bring up the standard calculated field box.
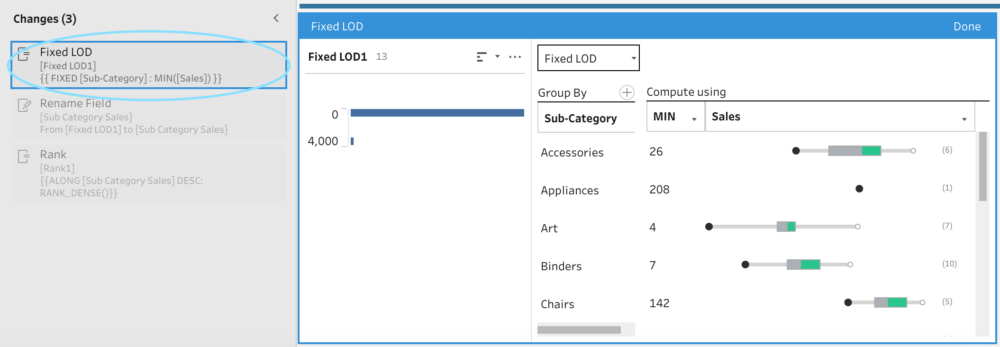
Again, a nice touch to keep things consistent. If someone was just writing the calculations themselves, it would be quite irritating to have the visual window pop up. On the contrary, for someone who isn’t used to LODs might feel a bit put off seeing some unfamiliar syntax to edit something they’ve built in the visual window.
Rank
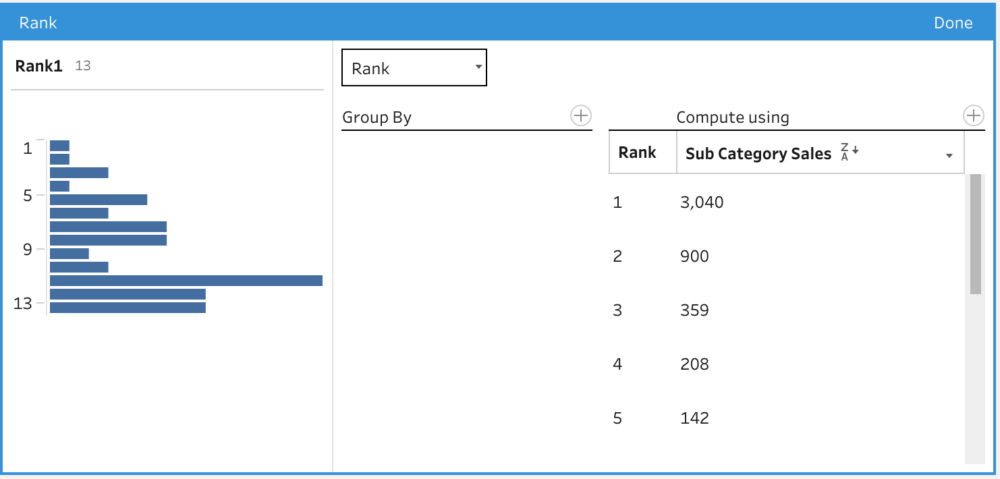
Now to perform our rank. We can create a calculation on the sub-category sales field and select rank. Simple as that (in this case), we now have a rank attached to our sub-category sales. You’ll see the rank visual calculation is very similar to that of LODs. We have the option to group by, you can also change the field you are ranking from the compute using drop down. To change between ascending or descending, you can select the A-Z next to the field name.
If we wanted to rank the sales within a sub-category, we need to use the group by field. This will perform the equivalent of a table calculation for us and rank each order within the sub-category. If we wanted to calculate a rank within the sub-categories at a less granular level, we would have to aggregate the data first using an LOD.
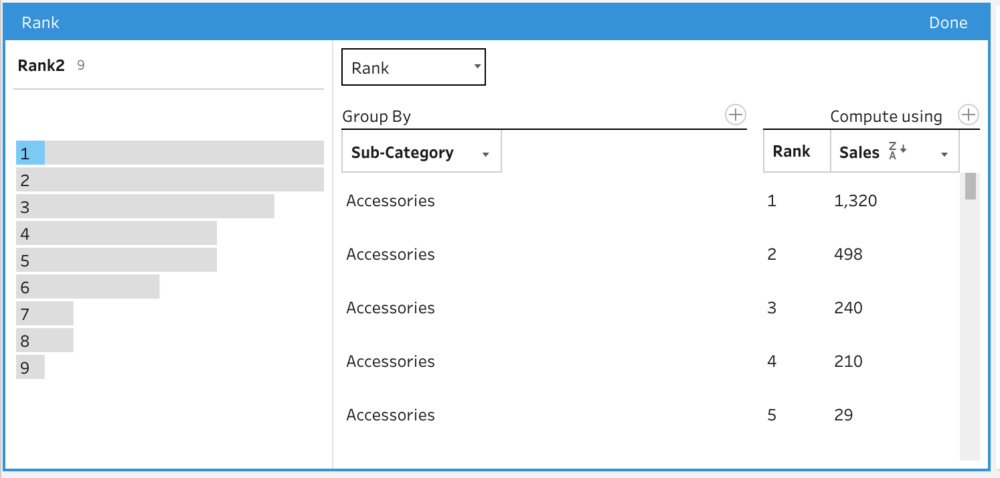
Like with LODs, we can edit the calculation from the changes window and bring up the visual calculation window. If you look at the calculation window, you’ll see how this rank calculation has been formed. An insight to how the manual rank calculations are to be written in Tableau Prep.
Something to note with this visual window is that it will only produce a RANK_DENSE. To those unfamiliar with Tableau’s ranking, this will assign an individual rank to each individual value, with no gaps in between the ranks. So 10, 8, 8, 7 in descending order would give 1, 2, 2, 3. To achieve other rank types, the calculations will have to be typed out. We will get onto this below.
‘Hand-written’ calculations
LOD
Not much to write home about here, the hand-written calcs are very much as you’d expect for LODs. Typing ‘FIXED’ into the calculation window will pop up the curly braces and then we can begin to write our calculation.
To calculate the average discount for each state you would write:
{ FIXED [State] : AVG(Discount) }
There’s an assumption here that you are familiar with LODs from Tableau Desktop. If you are not, I would recommend some of the following blog posts from Hania Nykowska which give some explanations to help demystify LODs.
Some points to be aware of, you can only write FIXED LODs. Of course this is to do with the use cases of INCLUDE and EXCLUDE LODs. The use cases for these are specific to the visualisation you are creating and what you do or don’t have in the view. With there being no view in Tableau Prep, you should be able to achieve your calculations with a FIXED LOD.
You also can’t write nested LODs in Tableau Prep, the calculation window will error out. You can achieve the same effect by then writing another LOD calculation containing the LOD field that you have just created, but you have to build the fields on top of each other. For example you cannot write :
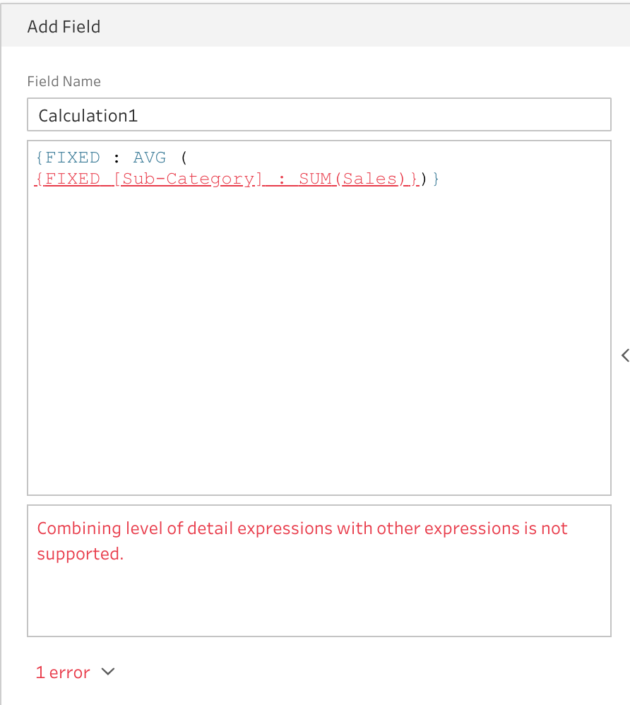
However, you can write:
Sub-Category Sales = { FIXED [Sub-Category] : SUM(Sales) }
Then:
{ FIXED : AVG([Sub-Category Sales]) }
To achieve the same result
Rank
Hand-writing the rank calculations are where things become slightly different from Tableau Desktop and also the visual calculation window.
In Tableau Desktop, you would typically write:
RANK(SUM([Sales]))
And then configure your table calculation accordingly. However, there are no table calculations to configure in Tableau Prep, so the syntax for the calculations is slightly different.
The general formula for writing a rank calculation in Tableau Prep is as follows:
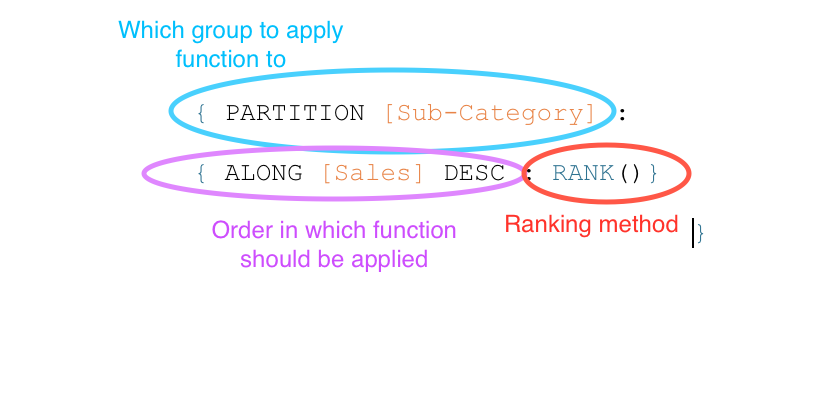
- Partitions define the group to apply the analytical function to
- Along defines the order in which an analytical calculation should be applied.
- ASC/DESC indicates an ascending or descending rank
- Rank can be replaced with different ranking techniques. More to follow on these
So this calculation will look within each Sub-Category, and rank the sales in descending order. The along function must always be contained within the partition function.
‘Along’ expressions can also be written independently. These define the order in which an analytical calculation should be applied. See below.
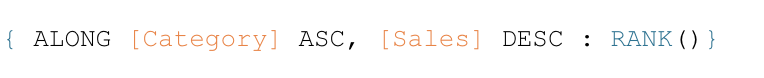
This calculation will sort the data in the order Sub-Category ascending and Sales descending and then apply a rank to the table. The default order for sorting is descending, so unless ASC is specified, Tableau will sort the fields descending. As there is no partition in this calculation, the rank will be applied across the whole table.
The partition function is essentially how you would be breaking up your view in Tableau Desktop.
Remember that the visual ranking window will always provide you with a RANK_DENSE. The functionality to change this may be added in the future, but at the moment to achieve other types of rank then the calculations must be typed out.
Types of Rank
There are several types of rank that can be applied in these expressions and they are as follows:
RANK() : This is your standard competition rank. So values of 10, 8, 8, 7 in descending order would give the ranks 1, 2, 2, 4.
RANK_DENSE() : With a rank dense, identical values are assigned to identical ranks, but there are no gaps between the ranks. So values of 10, 8, 8, 7 in descending order would give the ranks 1, 2, 2, 3. This is the method applied by default in the visual window.
RANK_MODIFIED() : This was touched on earlier, similar to standard competition rank but with a slight difference. Values of 10, 8, 8, 7 in descending order would give the ranks 1, 3, 3, 4.
RANK_PERCENTILE() : This returns the percentile rank for each value in the partition. So for our values 10, 8, 8, 7 in descending order would give 25, 75, 75, 100.
The rank function must always be applied at the end of the along and/or partition expression.
So that’s it! You’re now up to date on how to calculate LODs and analytical calculations in Tableau Prep. I hope you’ve found this guide useful. Feel free to reach out if you have any questions.
Jack