

31 October 2014
The ChallengeIt started with an internal post within The Information Lab from our colleague Robin Kennedy that went something like this... Chris[/caption][caption id='attachment_3985' align='aligncenter' width='400']
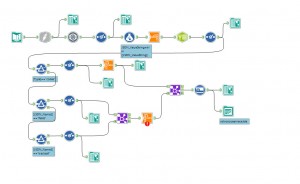 Robin[/caption][caption id='attachment_3986' align='aligncenter' width='400']
 Andy[/caption][caption id='attachment_3992' align='aligncenter' width='400']
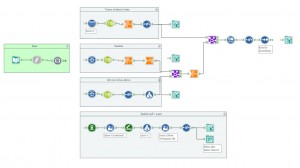 Tim[/caption]Everyone's solution was slightly different , the smallest number of tools used to go from a complex json file to a usable extract was just 13 tools. No coding required. Here's Tim's solution for you to download - link.The VisualisationsEveryone went for a slightly different solution, some recreating the original dashboard, others doing something new. Some people did it quickly, others spent a bit more time. These dashboards were originally for a bit of internal fun but the quality was so high we decided to publish them for all to see. Click on the image to jump to the Tableau Dashboard.[caption id='attachment_3991' align='aligncenter' width='300']
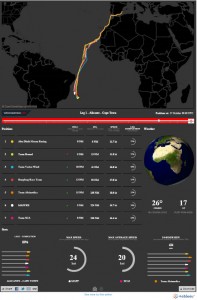 Andy[/caption][caption id='attachment_3988' align='aligncenter' width='400']
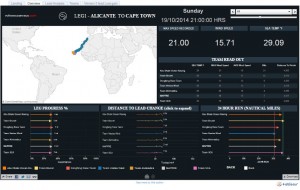 Tim[/caption][caption id='attachment_3990' align='aligncenter' width='400']
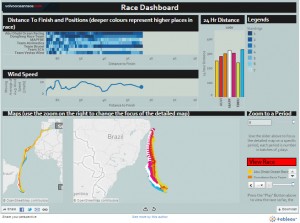 Chris[/caption][caption id='attachment_3989' align='aligncenter' width='400']
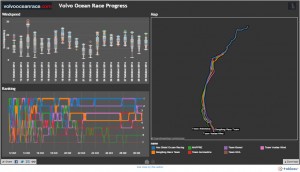 Robin[/caption] The Winner?Andy Pick won the internal vote with his faithful recreation in Tableau of the original dashboard, what do you think? Worth winner?Fancy the Challenge?If you want a go at the challenge you can do it for free, download your copy of Alteryx today from here and trial of Tableau here and get cracking. We'd love to see your results. Tweet us them at @infolabuk or drop us a comment below. Your efforts don't need to match ours, we just had fun doing it and I'm sure you will too.
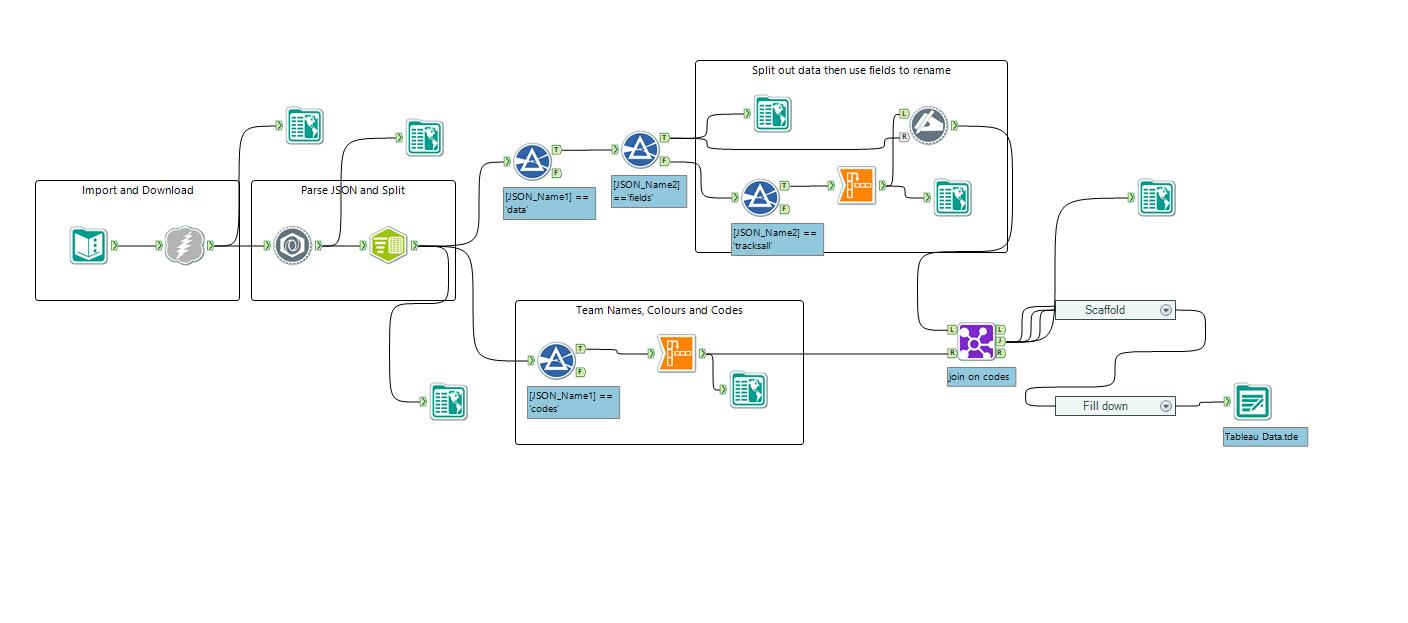
'Challenge for the week for everyone with a bit of spare time ...Build a version of the Volvo Ocean Race dashboard.http://www.volvooceanrace.com/en/dashboard.htmlYou can get the data from here: http://www.volvooceanrace.com/en/rdc/VOLVO_WEB_LEG1_2014.jsonBuild your own Alteryx modules and Tableau dashboards and we'll have a Viz-off on Friday!'The JSON ProblemThe first problem encountered was the data format, it's JSON, without Alteryx this wouldn't be much fun to decode but Alteryx made it a 'breeze' (pun intended). The JSON parse tool is just made for the job. There are two modes with the tool, everyone opted to split the data out into a single String fields and then split it using the Text to Column Tool.Here's the four resulting modules:[caption id='attachment_3984' align='aligncenter' width='400']
 Chris[/caption][caption id='attachment_3985' align='aligncenter' width='400']
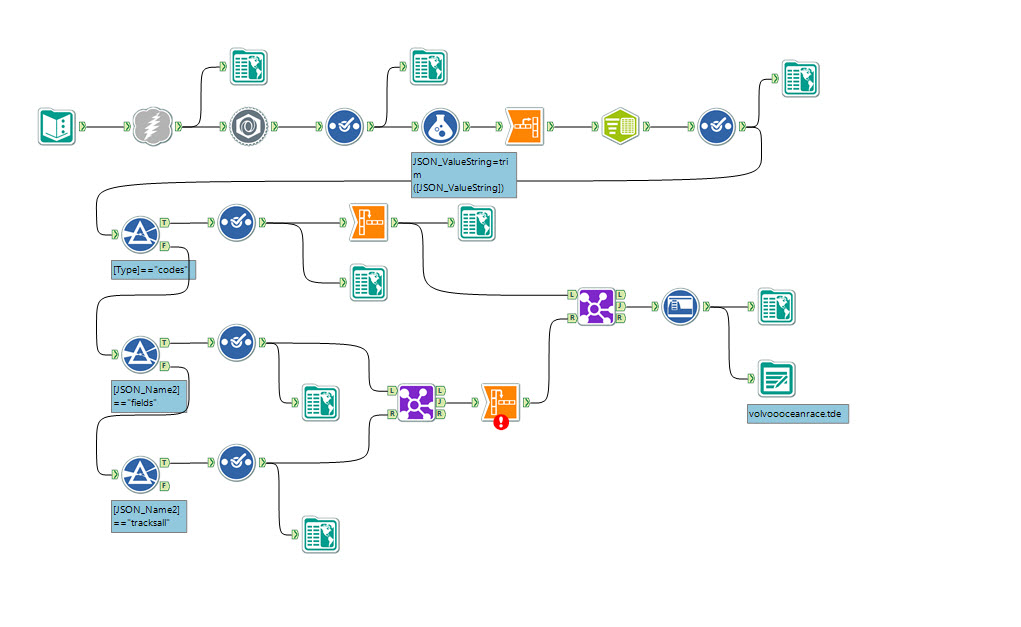 Robin[/caption][caption id='attachment_3986' align='aligncenter' width='400']
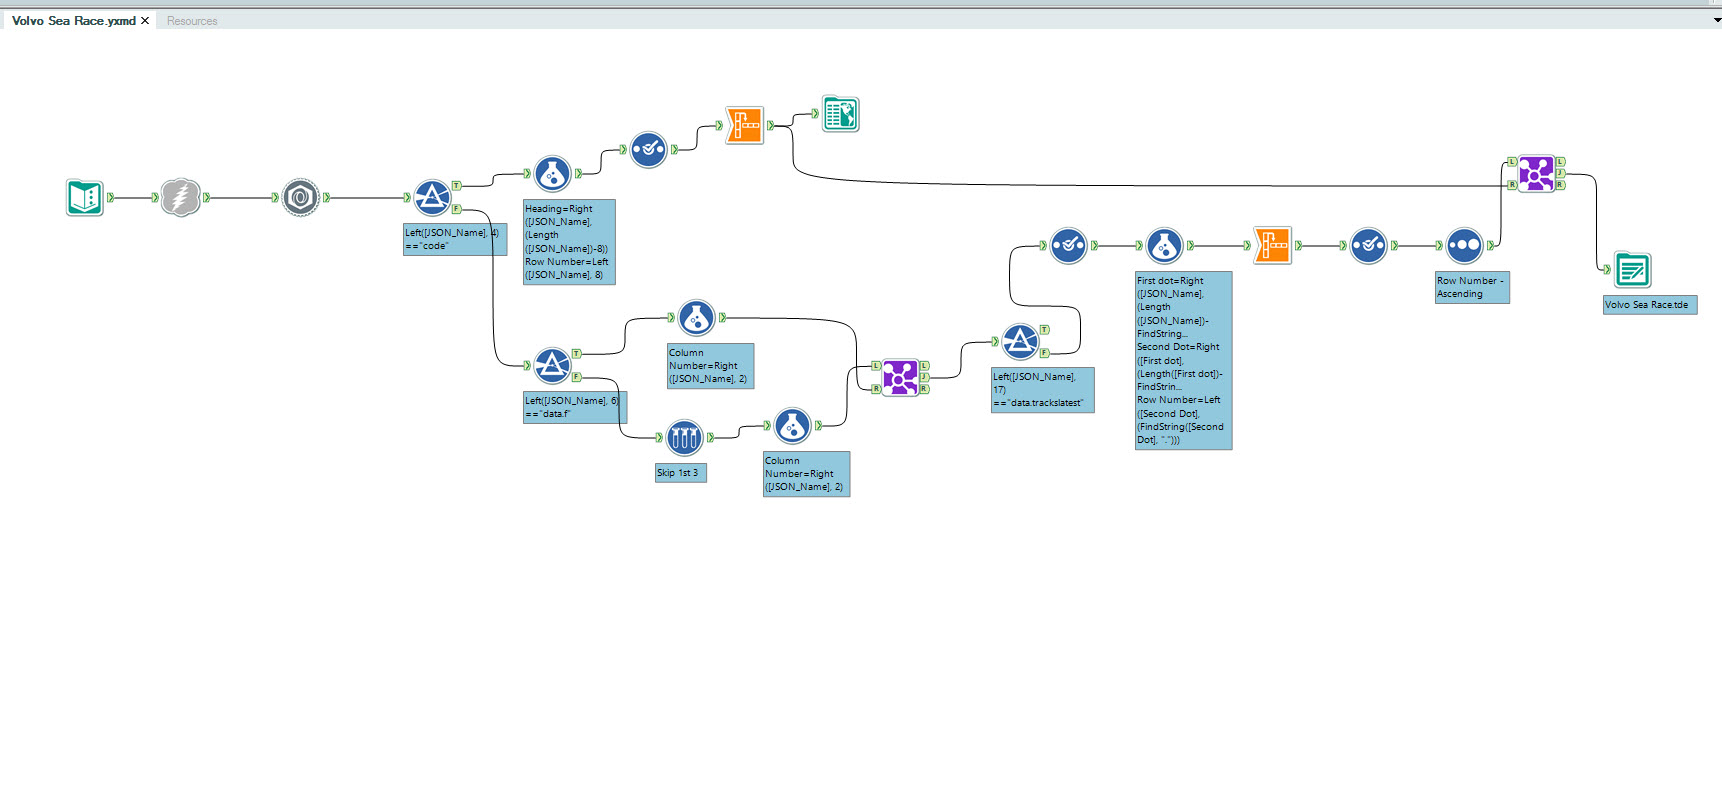 Andy[/caption][caption id='attachment_3992' align='aligncenter' width='400']
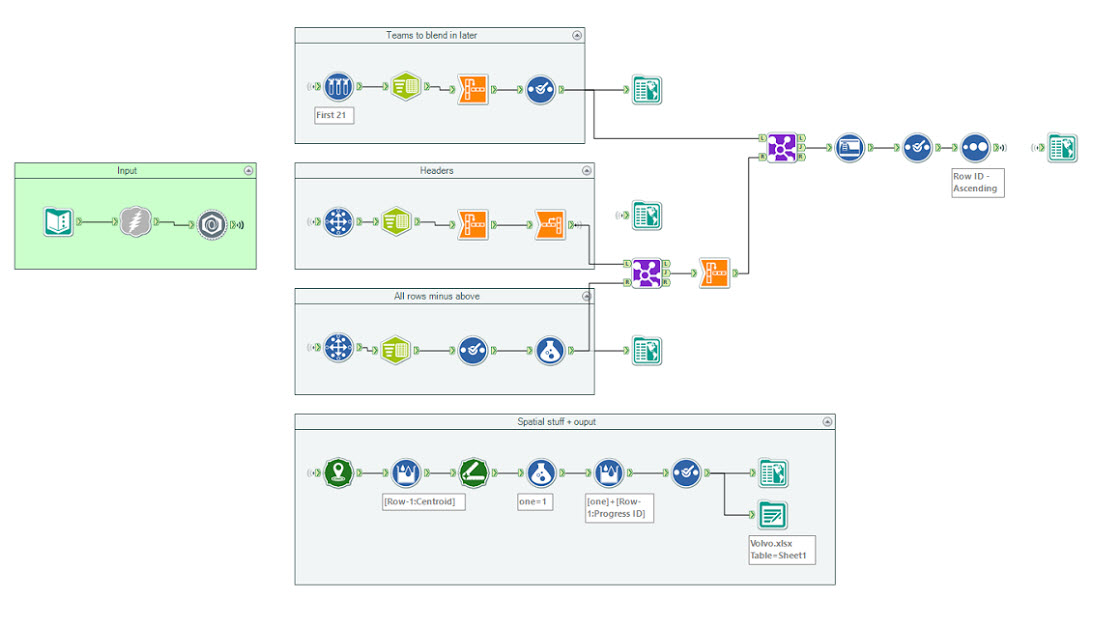 Tim[/caption]Everyone's solution was slightly different , the smallest number of tools used to go from a complex json file to a usable extract was just 13 tools. No coding required. Here's Tim's solution for you to download - link.The VisualisationsEveryone went for a slightly different solution, some recreating the original dashboard, others doing something new. Some people did it quickly, others spent a bit more time. These dashboards were originally for a bit of internal fun but the quality was so high we decided to publish them for all to see. Click on the image to jump to the Tableau Dashboard.[caption id='attachment_3991' align='aligncenter' width='300'] Andy[/caption][caption id='attachment_3988' align='aligncenter' width='400'] Tim[/caption][caption id='attachment_3990' align='aligncenter' width='400'] Chris[/caption][caption id='attachment_3989' align='aligncenter' width='400'] Robin[/caption] The Winner?Andy Pick won the internal vote with his faithful recreation in Tableau of the original dashboard, what do you think? Worth winner?Fancy the Challenge?If you want a go at the challenge you can do it for free, download your copy of Alteryx today from here and trial of Tableau here and get cracking. We'd love to see your results. Tweet us them at @infolabuk or drop us a comment below. Your efforts don't need to match ours, we just had fun doing it and I'm sure you will too.