

Covid-19 has presented the higher education industry with many challenges but arguably one of the most prescient right now is the issue of student number planning. It the best of times it would be a challenging undertaking to say the least but given the current climate of uncertainty it has become arguably even more crucial than ever.
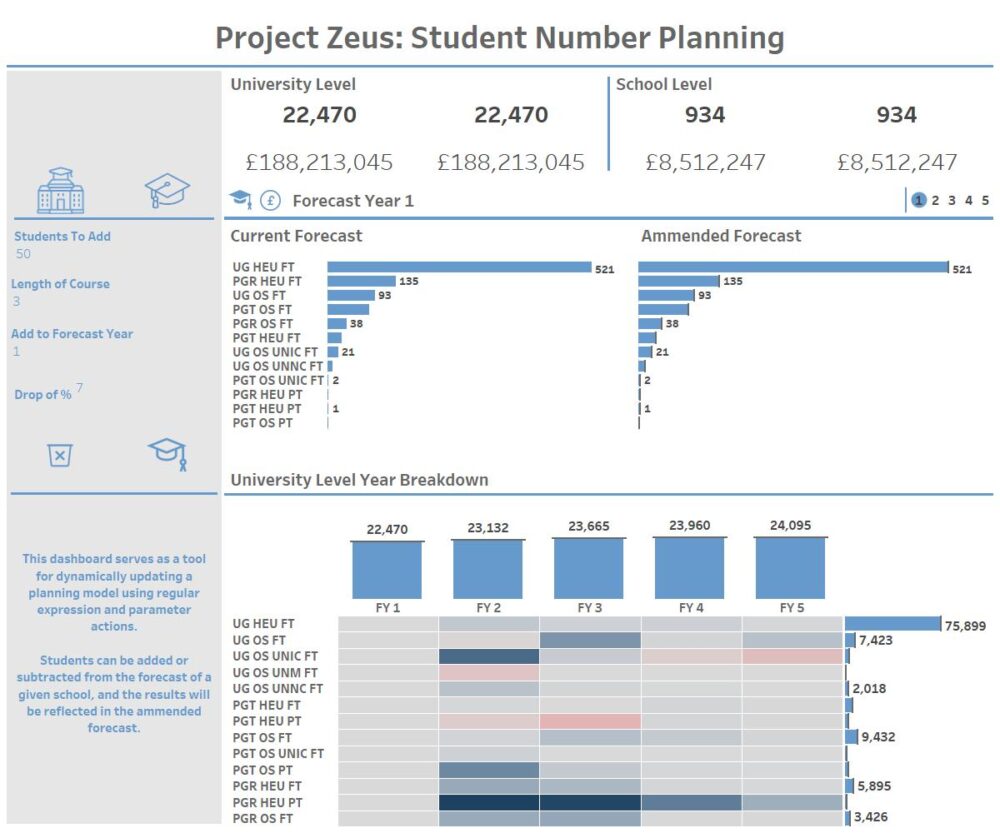
The point of this blog post is not looking at how to build a student number planning model from scratch because that isn't really Tableau's forte. What is much more up Tableau's alley is allowing users to connect to data an explore it to ask the questions that really matter. Being able to not only see the model presented in a visually striking way but also allowing the user to dynamically make changes to the forecast from within the dashboard and instantly see the effects this has on the number of students and expected funding;
To make this happen I used potentially one of my favourite techniques in Tableau, using parameters as a data source. In a nutshell this technique relies on me using a parameter action to turn a parameter into a list that captures the selections made by the user. I then use regular expression, another favourite of mine to bring this information back out again and use it to populate my graphs. This is just a high-level description of what's happening behind the scenes, if you read on, I'll explain what these techniques are if you're unfamiliar with them, and how I used them to construct the dashboard.
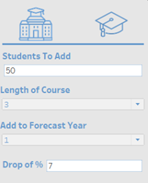
As shownby the elements in the dashboard controls, I've set up the follow parametersfor Student Type, School, Length of course, drop off % and forecast years. Theuseful thing about using parameters for this is that as placeholder values theuser can specify what their values and then they can be passed into acalculated field.
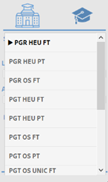
The values for school and student type are updated using parameter actions so that the value in the list that the user clicks will then be the value of the respective parameter. The other parameters are updated in a more conventional way, using text entry fields and dropdown.
But now that we've got our user inputs, what do we actually want to do with them?
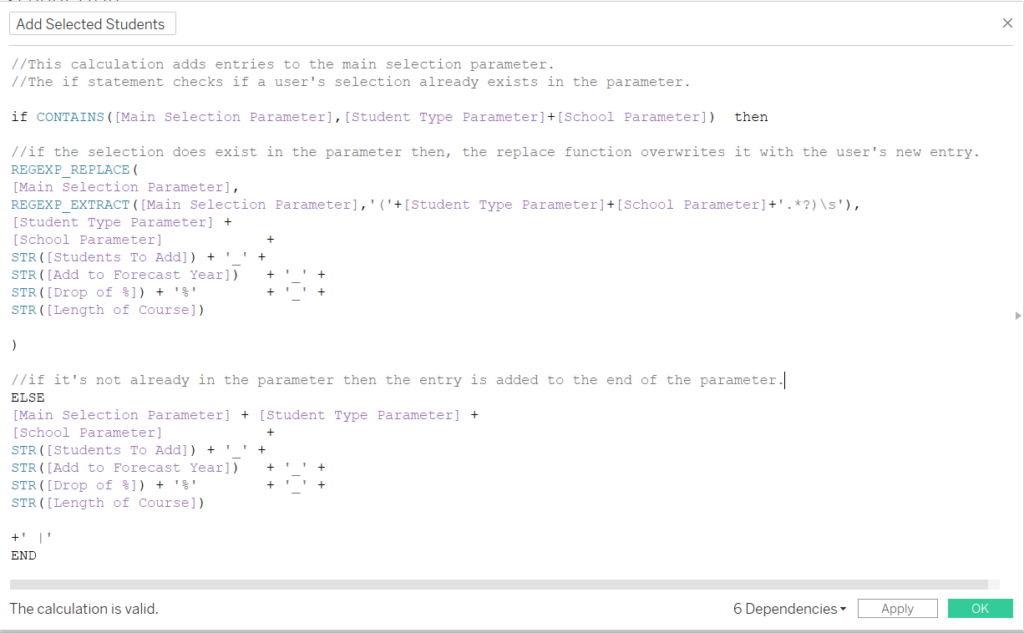
This isthe calculation I use to update the Main Selection parameter when the button toadd the students is clicked and it's more or less the backbone of thedashboard. There's a few things that it does so I'll break it down in stages.
The first if statement checks if the Main Selection parameter contains the student type and school that the user has selected. If the parameter does already contain the school and student type, then a combination of regex functions are used to overwrite the existing entry.
regexreplace - thislooks for a specific value in a string and overwrites it. This is how theexisting entry is overwritten.
regexextract - thislooks for a specific pattern in a string and returns it. By nesting this in thereplace statement, this is how I replace only the entry that matches the user'scurrent selection.
The entryis replaced by a string made up of the various user selected parameters,separated by underscores.
If theuser has not made this selection of school and student type already then theselected parameters are concatenated together separated by an underscore andadded to the main selection parameter.
Theresult is a string that looks something like this:
PGR HEU FTBiosciences50_1_7%_3 |
Now thatwith successive user entries made the Main Selection parameter has beenpopulated, the next task is to extract that information in a way that allow theuser's entries to be added or subtracted from the underlying forecasting data.The end goal here is to have a new field which is a count of the students thathave been added as a result of the user's actions, and have this field split byschool and student type.
Business Logic
As wellas this we want to build in some business logic base on the data that we'reusing: within each combination of school, student type and forecast year, thereare different stages. The way to think about stages is to treat them like astudent's progress through their academic course. For example, a student instage 1 of their course in Forecast Year 1 will be in stage 2 of their coursein the next forecast year.
With thisin mind, how the process of adding student's will work is that when studentsare added is that whichever forecast year the user chooses as the startingyear, students will be added to all successive forecast years based on thelength of the course selected. In each successive forecast year, the stage ofthe added students will be incremented by 1 and the drop off percentage will beapplied.
In simpleterms this means that if 50 students are added to forecast year 1 for a givencourse, then in the first year there will be an additional 50 students in stage1, then in the following forecast year 50 students will be added to stage 2minus the drop off figure.
Extracting the data
Themethod for extracting the data uses Regex as I mentioned, and in practice howit works is by iteratively extracting the earliest part of the entry as acalculated field, and then using that calculated field in subsequentcalculation to extract the next piece and so on until the entire entry has beenextracted. Showing my calculations below will help to explain this in moredetail.
On itsown this calculation may look confusing, but as a field in a table it makesmore sense.
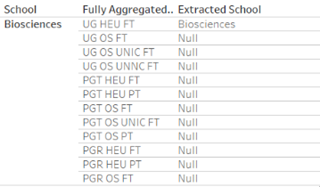
Given thevalue of the list is - UG HEU FTBiosciences50_1_7%_3 |
What this calculation does is tell the regex to look in the parameter for student type and school. By enclosing school in brackets, I am telling the regex that this is the part of the string that I want returned. By putting this in a table what we can see is that for each row it is looking for that given combination of school and student type in the parameter, when the combination actually exists in the parameter it returns the school otherwise it returns a null.
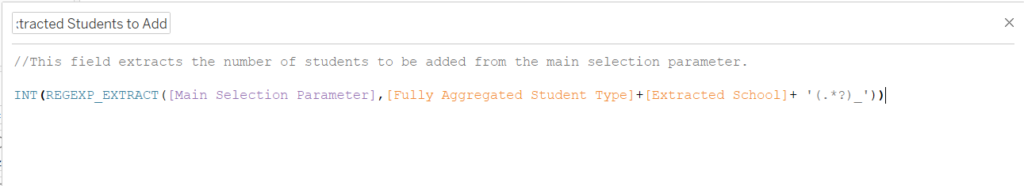
Using this same method, I then extract all the other information in sequence. For example, my formula to extract the number of students to add looks like this:
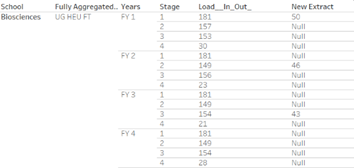
The next step is to construct an if statement that builds in the business logic that I mentioned earlier so that the end result is as shown below. The new extract field displays the correct number of students to be added against a school and student type, factoring in the drop off percentage and the relevant stages.
The finalpiece then is to work out the recalculated forecast and using the New extractfield this is simply a case of adding new extract to the existing student numberto work out the revised count. Multiplying the revised count by the relevantfee amount then provides the recalculated fee amount as well.
So in a nutshell this was how the dashboard was put together, I’ve left out some of the formatting steps but with the information I’ve provided here it should be feasible to replicate the steps and achieve a similar result. It’s worth noting though, that no solution is ever perfect and this one is no different. The main caveat with this for example is the complexity of the calculations that sit behind the dashboard. While I’ve done my best to make sure that all the calculations are commented, it still takes a bit of time to get your head around them; for me they were the results of lots of iteration and trial and error. If something like this was handed over to someone to maintain then their ability to do so would depend heavily on their understanding of Regex and Parameters. As with all things though it’s worth assessing what your needs are and then deciding whether or not the solution you go for is going to be a help or a hindrance in the long run.
The interactive Tableau Viz can be found here: https://tinyurl.com/yy6s2qzv