15 February 2018
I'm sure I'm not the only one but when LODs appeared in Tableau it took me a long time until I started getting used to them and to stop being scared to use them in a daily basis. Now I'm more in love with LODs every time I use one. Not because they allow you to do things you could before - that sometimes it's the case - but especially because it makes things much easier and faster. Here's an example I hope you find useful.I have been working a couple of days on a visualization about pollution in Madrid using public data. More concretely presence of dioxide of nitrogen in the atmosphere in several areas of the city. Each record is a measure of dioxide of nitrogen in a concrete area of Madrid for every hour of every day between 2014 and 2017. This is the final viz I created (sorry, the viz is in Spanish).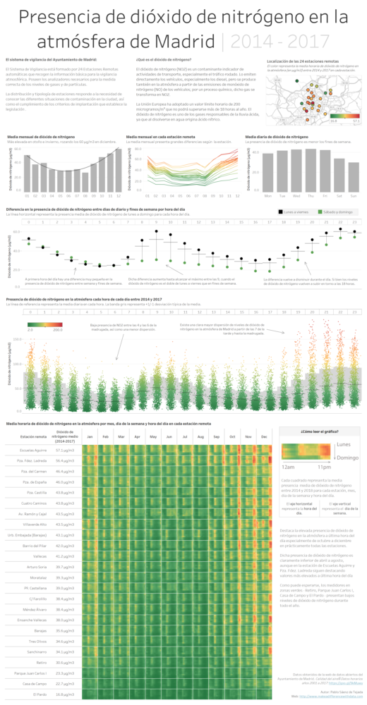 But for this post I want to focus on a concrete section of the viz. This one:
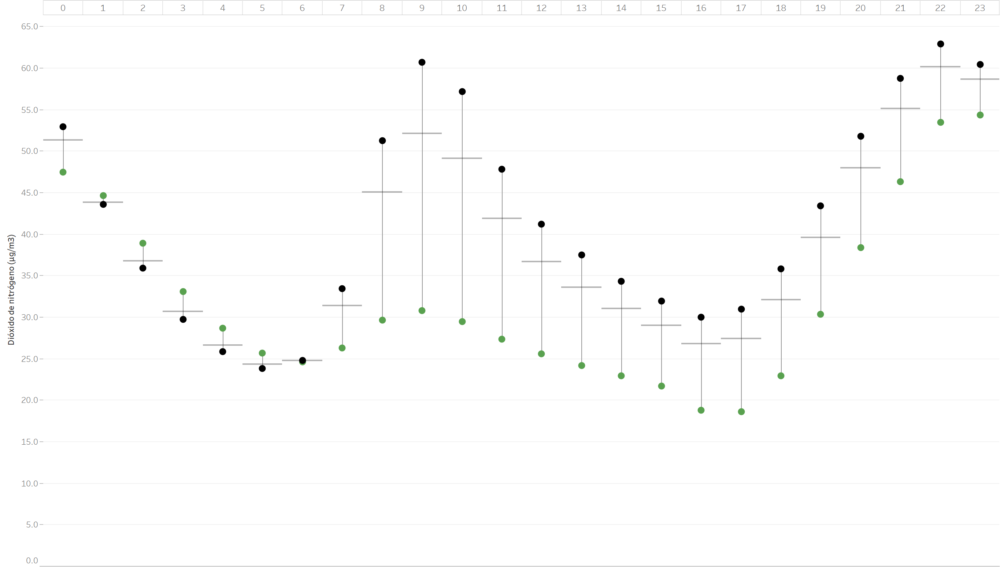
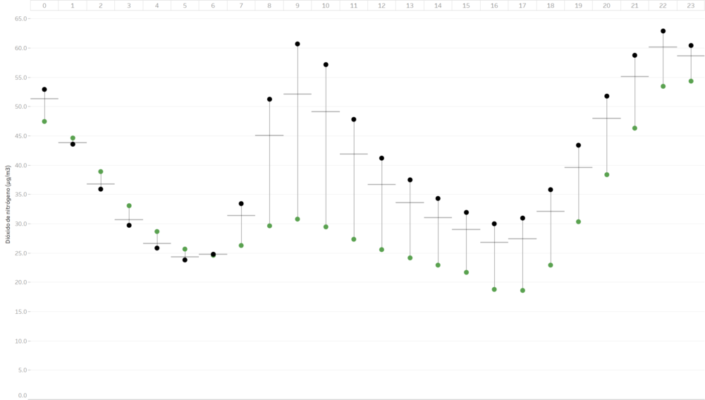 This chart is showing the average value of dioxide of nitrogen in Madrid every hour of the day (00h to 23h in columns) during the weekends (green circles) and working days (black circles). The line connecting both circles is just to highlight the gap between both marks and the horizontal lines are the average for each hour. As you can see the average is closer to the black circles. This is because the average is taking into account all the week days and not just the two circles. It's the weighted average by the number of days - 5 for working days and 2 for weekend days -. How can we create in an easy and elegant way this kind of weighted average?But let me explain how I built this chart. Is not a difficult one at the end.
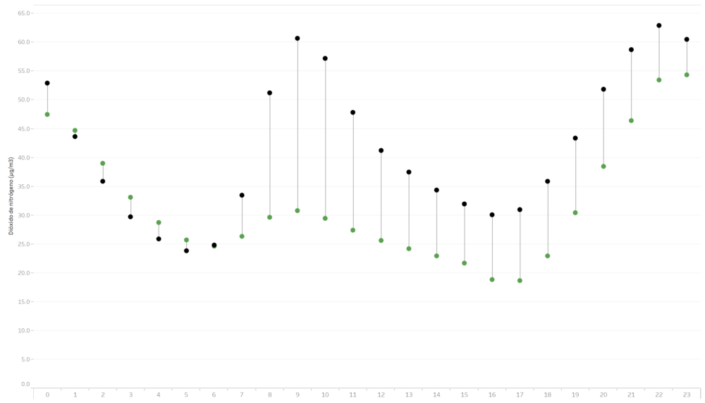 We are quite close to the final result that we want. But if we just add an average line from the Analytics Pane for each cell, we will get something like this:
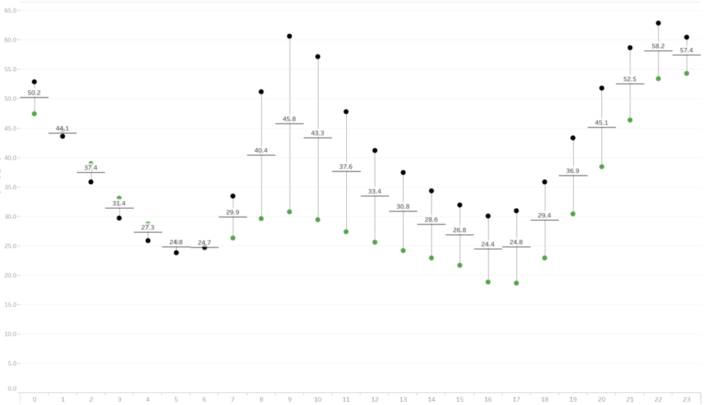 Is this correct? Well, it's giving me the average between my two marks - working days and weekends - but is that really the average for each day of the week? Let's create a simple viz showing the average of our measure by hour to double check:
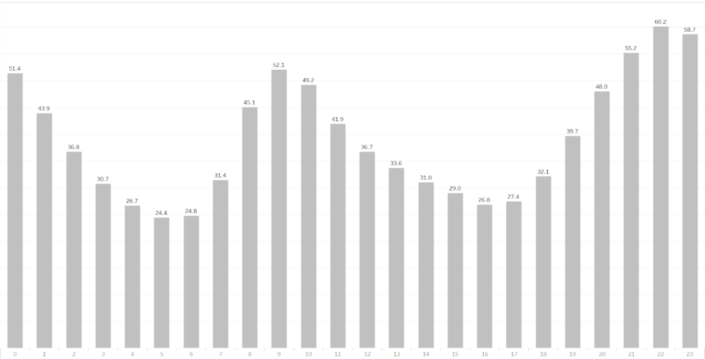 So the values are close... but aren't exactly the same, why? Because there are 5 working days and 2 weekend days. This means we don't want to sum the working days average and the weekend average and divide it by two, that is what is happening now in our viz. We want it to take into account the fact that there are more working days than weekend days (as in the image above). We want in this case an average of the dioxide of nitrogen weighted by the number of days that working days have (five) and weekends have (two).How we do that? like almost everything in Tableau, there are several ways of doing it. We could count the number of days for each of our marks and use that to weight our calculation. But there's a much easier and elegant way to do it with an exclude LOD. So if we create a calculated field where we EXCLUDE our weekdays group created before and calculates the AVG of our value, like this:
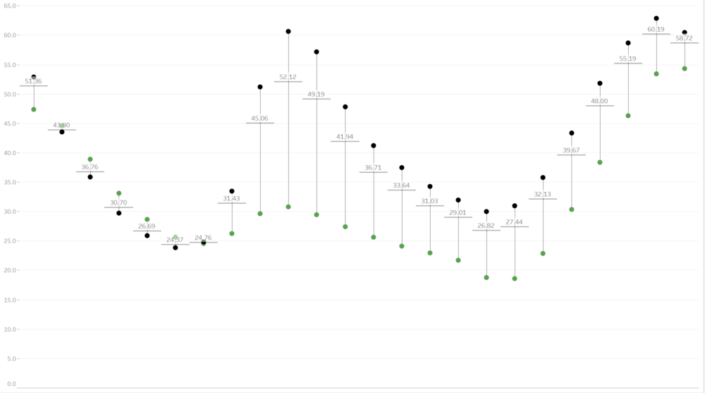 If we compare the values of our new reference line to the ones of the bar chart created before, we see they match. The LOD is excluding our weekdays group from the level of detail and calculating the average of our value less aggregated than before. So know the average is closer to our working days mark what makes complete sense. And with a much more elegant calculation saving us also a lot of time to build it.
 But for this post I want to focus on a concrete section of the viz. This one:
 This chart is showing the average value of dioxide of nitrogen in Madrid every hour of the day (00h to 23h in columns) during the weekends (green circles) and working days (black circles). The line connecting both circles is just to highlight the gap between both marks and the horizontal lines are the average for each hour. As you can see the average is closer to the black circles. This is because the average is taking into account all the week days and not just the two circles. It's the weighted average by the number of days - 5 for working days and 2 for weekend days -. How can we create in an easy and elegant way this kind of weighted average?But let me explain how I built this chart. Is not a difficult one at the end.
- I used my date field to create a custom date with the weekdays. This is very simple in Tableau, you just need to right click on your date field > Create > Custom Date and in this case, select Weekdays as date part.
- I created a group based on that new custom date grouping working days (Monday to Friday) and weekends (Saturday and Sunday).
- Now the viz itself it's also easy: The hour of the date in columns, and my measure twice in rows, one as a line mark using my Weekdays Group from step 2 in the path. The other one as a circle mark with the Weekdays Group in colour.
 We are quite close to the final result that we want. But if we just add an average line from the Analytics Pane for each cell, we will get something like this:
 Is this correct? Well, it's giving me the average between my two marks - working days and weekends - but is that really the average for each day of the week? Let's create a simple viz showing the average of our measure by hour to double check:
 So the values are close... but aren't exactly the same, why? Because there are 5 working days and 2 weekend days. This means we don't want to sum the working days average and the weekend average and divide it by two, that is what is happening now in our viz. We want it to take into account the fact that there are more working days than weekend days (as in the image above). We want in this case an average of the dioxide of nitrogen weighted by the number of days that working days have (five) and weekends have (two).How we do that? like almost everything in Tableau, there are several ways of doing it. We could count the number of days for each of our marks and use that to weight our calculation. But there's a much easier and elegant way to do it with an exclude LOD. So if we create a calculated field where we EXCLUDE our weekdays group created before and calculates the AVG of our value, like this:
AVG({EXCLUDE [Weekdays Group] : AVG([Value])})
And we add that calculation to our details shelf and use it as our reference line we get then something like: If we compare the values of our new reference line to the ones of the bar chart created before, we see they match. The LOD is excluding our weekdays group from the level of detail and calculating the average of our value less aggregated than before. So know the average is closer to our working days mark what makes complete sense. And with a much more elegant calculation saving us also a lot of time to build it.