

9 February 2016
A step by step guide to using custom sql to fill a date range in Tableau. By Andrew Pick
Recently I have received a number of requests from users to create a view showing a count of values between two dates. In theory this sounds quite straight forward but when the data is in the format shown below, it can be a little tricky.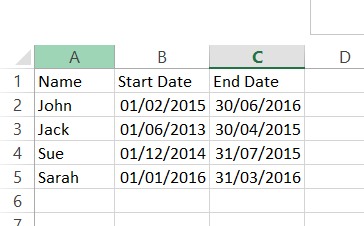 This sort of data often appears in HR data or in support desk ticket details. The requests came from users who wanted to see a count of people or tickets by month. So in the data above, January 2015 should have the count of 2, because Jack and Sue’s dates cover that month. So this would produce a visualisation similar to the one below, showing count of employees per month.
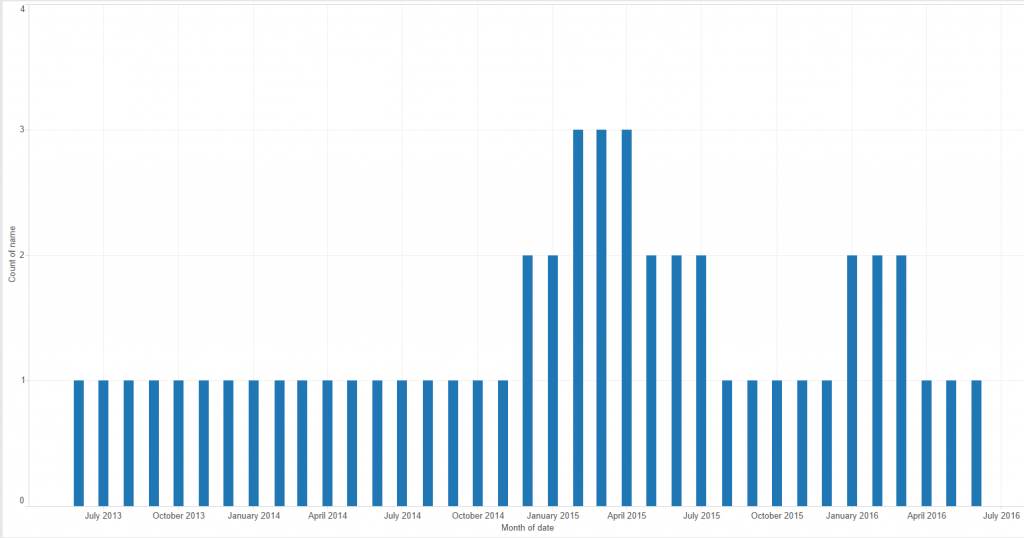 The main difficulty is creating a date dimension that you can use for your x axis, you can’t use either of the existing dates as they don’t contain all the points. There are a few ways around this, a data scaffold appears to be the most common, but this can bring other issues due to blending. A simpler method can be to use custom SQL (if the data source allows it, in this case, Excel does)Step one – Create another tab in your excel and input a range of dates that cover everything from your minimum to your maximum date. In this case I want to see month data and my earliest date is 01/06/2013 and my latest date is 30/06/2016.
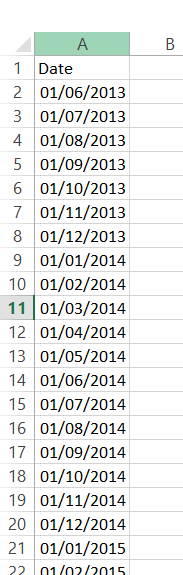 Step 2 – connect to your Excel in Tableau, but in the file browser instead of clicking open, select the drop down arrow next to the open button and select “Open with Legacy Connection” this will give you the ability to use a custom sql connection.
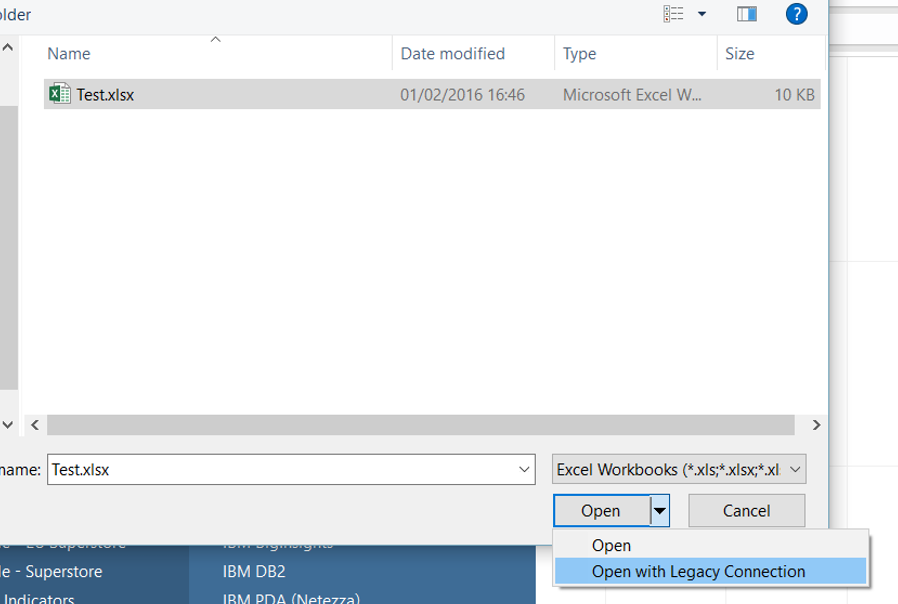 Step 3 – In the Tableau data connection window click and drag “New Custom SQL” from the left hand pane into the “Drag sheets here” section.
 Step 4 – this will open up the custom SQL input box, in here you need to input SQL similar to the following. You will need to adjust field names and table names depending on your data.SELECT [Names$].[name], [Names$].[start date], [Names$].[end date], [Range$].[date]FROM [Names$], [Range$]WHERE [Range$].[date] BETWEEN [Names$].[start date] AND [Names$].[end date]
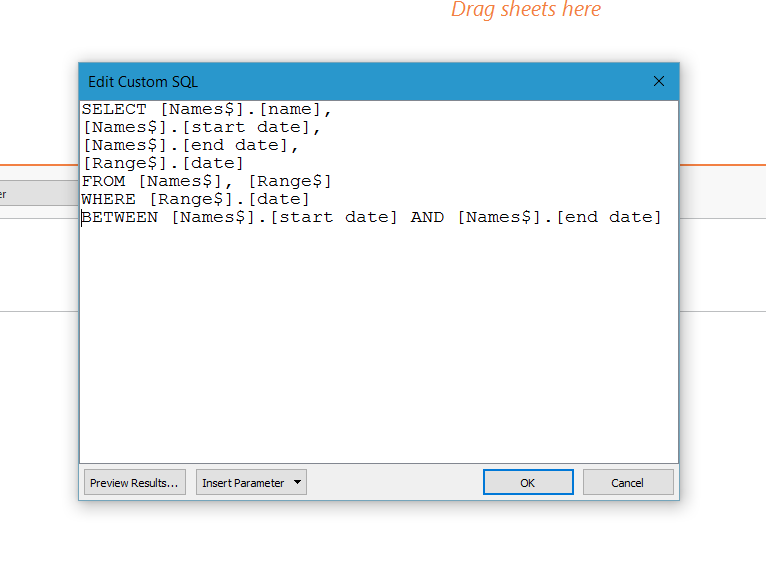 This will create a line of data for each month, for each employee, between their start dates and end dates.From this -To this -
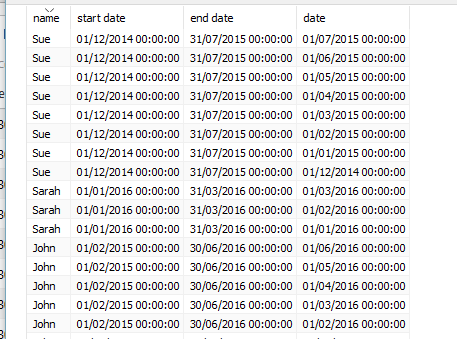 Step 5 – You can then use your data as you normally would in Tableau. To create the view I mentioned previously you can use the date field as your date axis and sum of number of records will give you the count of employees per month.
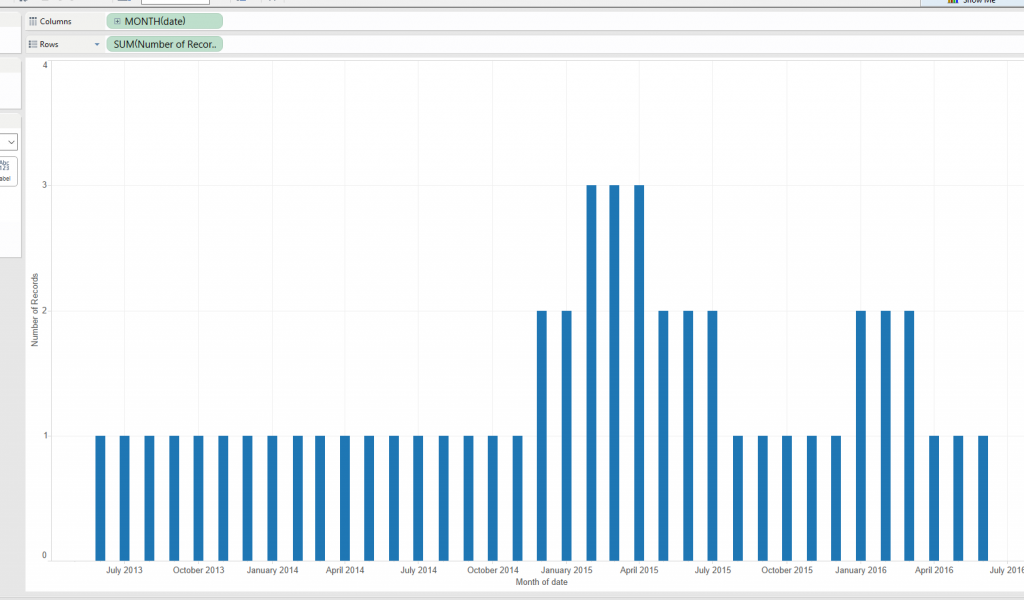 To caveat this there are a few things to consider, if you have measures in your data, these are going to be multiplied a number of times, so if you are going to use them in the same view you will have to use averages. Also this is going to increase the number of records in your data substantially so in some instances it may not be suitable.
This sort of data often appears in HR data or in support desk ticket details. The requests came from users who wanted to see a count of people or tickets by month. So in the data above, January 2015 should have the count of 2, because Jack and Sue’s dates cover that month. So this would produce a visualisation similar to the one below, showing count of employees per month. The main difficulty is creating a date dimension that you can use for your x axis, you can’t use either of the existing dates as they don’t contain all the points. There are a few ways around this, a data scaffold appears to be the most common, but this can bring other issues due to blending. A simpler method can be to use custom SQL (if the data source allows it, in this case, Excel does)Step one – Create another tab in your excel and input a range of dates that cover everything from your minimum to your maximum date. In this case I want to see month data and my earliest date is 01/06/2013 and my latest date is 30/06/2016.Step 2 – connect to your Excel in Tableau, but in the file browser instead of clicking open, select the drop down arrow next to the open button and select “Open with Legacy Connection” this will give you the ability to use a custom sql connection.Step 3 – In the Tableau data connection window click and drag “New Custom SQL” from the left hand pane into the “Drag sheets here” section.
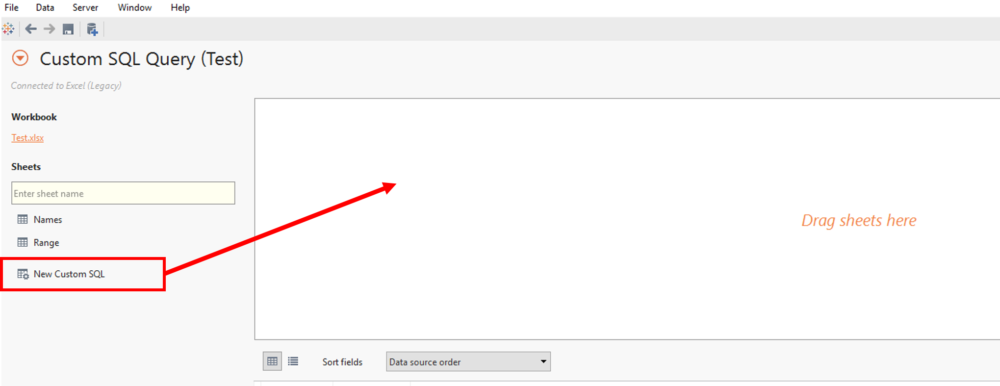 Step 4 – this will open up the custom SQL input box, in here you need to input SQL similar to the following. You will need to adjust field names and table names depending on your data.SELECT [Names$].[name], [Names$].[start date], [Names$].[end date], [Range$].[date]FROM [Names$], [Range$]WHERE [Range$].[date] BETWEEN [Names$].[start date] AND [Names$].[end date]This will create a line of data for each month, for each employee, between their start dates and end dates.From this -To this -Step 5 – You can then use your data as you normally would in Tableau. To create the view I mentioned previously you can use the date field as your date axis and sum of number of records will give you the count of employees per month.
 To caveat this there are a few things to consider, if you have measures in your data, these are going to be multiplied a number of times, so if you are going to use them in the same view you will have to use averages. Also this is going to increase the number of records in your data substantially so in some instances it may not be suitable.