

19 February 2018
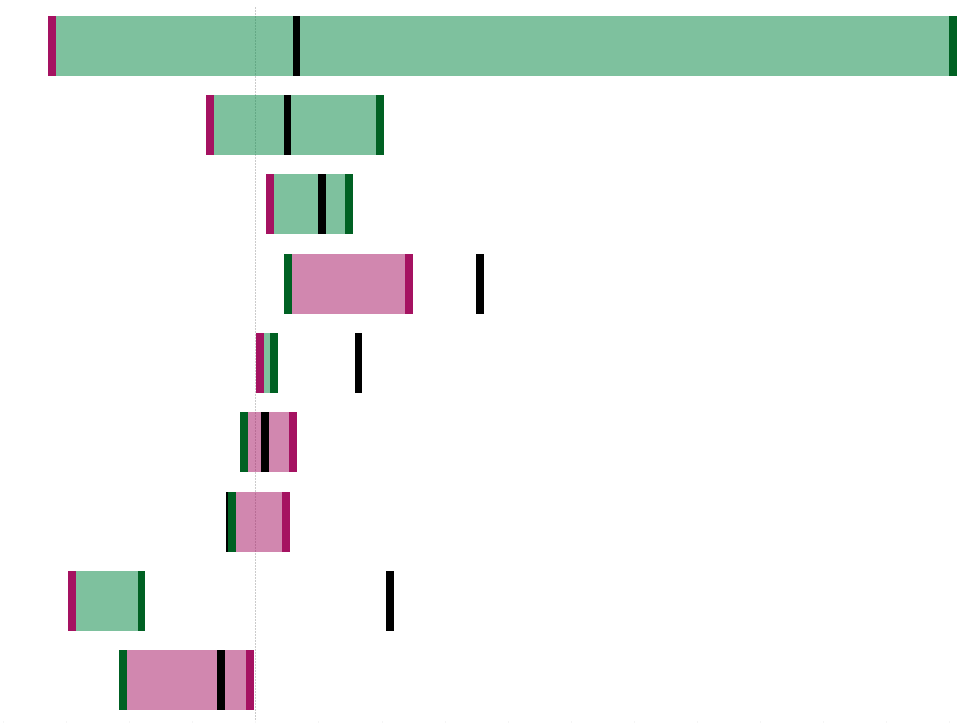
I was recently handed over the following chart to continue working on. It is a dual axis with both marks cards as Gantt bars. One axis has the thick horizontal bars and the other has the vertical end points for actual v budget as well as prior month (see below). What I want to do to improve this slightly is thicken the vertical endpoints so they are more distinguishable (if I increase the size on the marks card it only increases their height, I want to increase the width).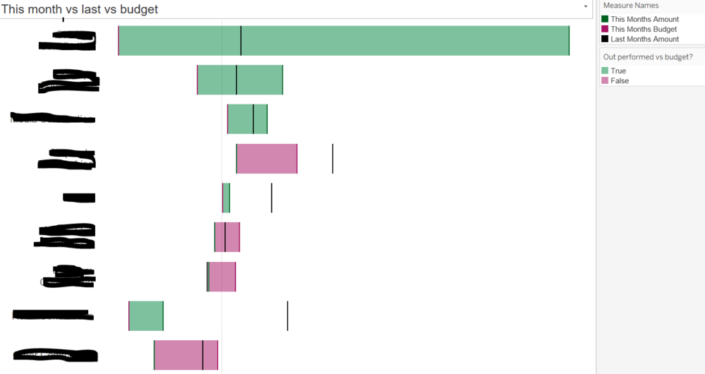 Initially I tried putting a calculation of SUM(0.3) on size but this is what happened.
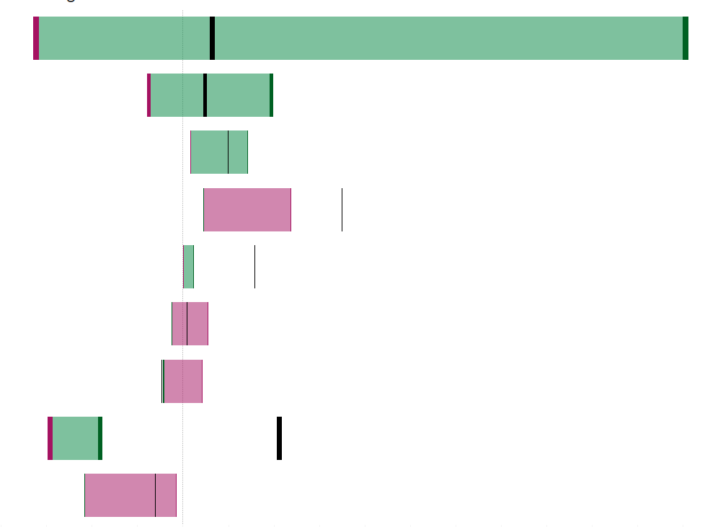 We can see here that the thickness of the Gantt endpoints are dependent on their distance from zero – this wasn’t what I was going for as I wanted them to be of equal size.This comes down to Tableau’s Order of Operations. As the calculation ‘SUM(0.3)’ is seen around the same level of detail as a Measure filter I needed to give this calculation a boost. The way I did this was by making it an LOD. It didn’t take much, just changing the calculation from ‘SUM(0.3)’ to ‘{SUM(0.3)}’ gave me this.
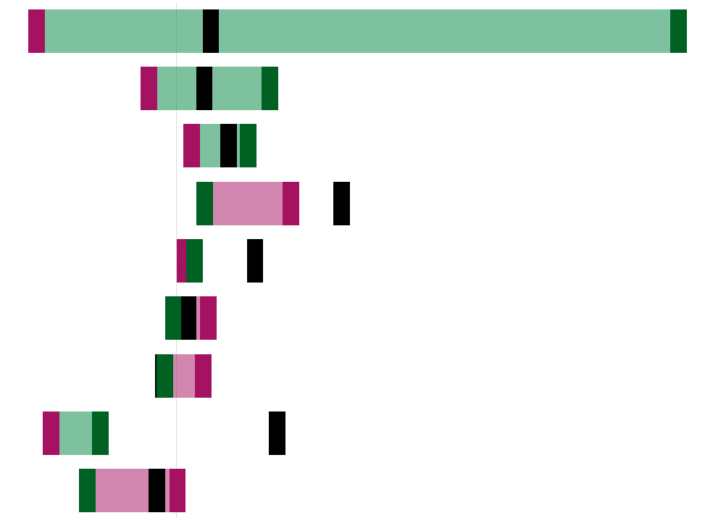 These were a little too thick for me so I brought down the 0.3 to 0.1 and that gave me the look I was after.
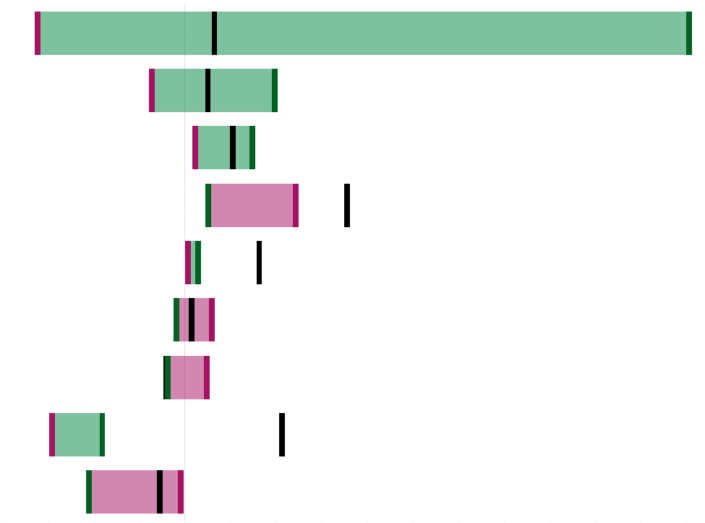 Now my Gantt endpoints were distinguishable from each other and most certainly visible.If you would like to construct some Gantts where they do vary in size I would suggest reading Gwylim Lockwoods blog here.
Initially I tried putting a calculation of SUM(0.3) on size but this is what happened.We can see here that the thickness of the Gantt endpoints are dependent on their distance from zero – this wasn’t what I was going for as I wanted them to be of equal size.This comes down to Tableau’s Order of Operations. As the calculation ‘SUM(0.3)’ is seen around the same level of detail as a Measure filter I needed to give this calculation a boost. The way I did this was by making it an LOD. It didn’t take much, just changing the calculation from ‘SUM(0.3)’ to ‘{SUM(0.3)}’ gave me this.These were a little too thick for me so I brought down the 0.3 to 0.1 and that gave me the look I was after.Now my Gantt endpoints were distinguishable from each other and most certainly visible.If you would like to construct some Gantts where they do vary in size I would suggest reading Gwylim Lockwoods blog here.