

24 November 2015
Hey. Here's another Good to Great Tip for those of you yearning to add another trick to your Tableau toolkit.You probably know the situation, you deliver an interactive Viz to a user and they click on the map filtering the rest of the charts - before long they're lost. What values are being filtered? Here's a way to solve that - simply by adding the filter values into the sheet titles. Click below for an interactive version.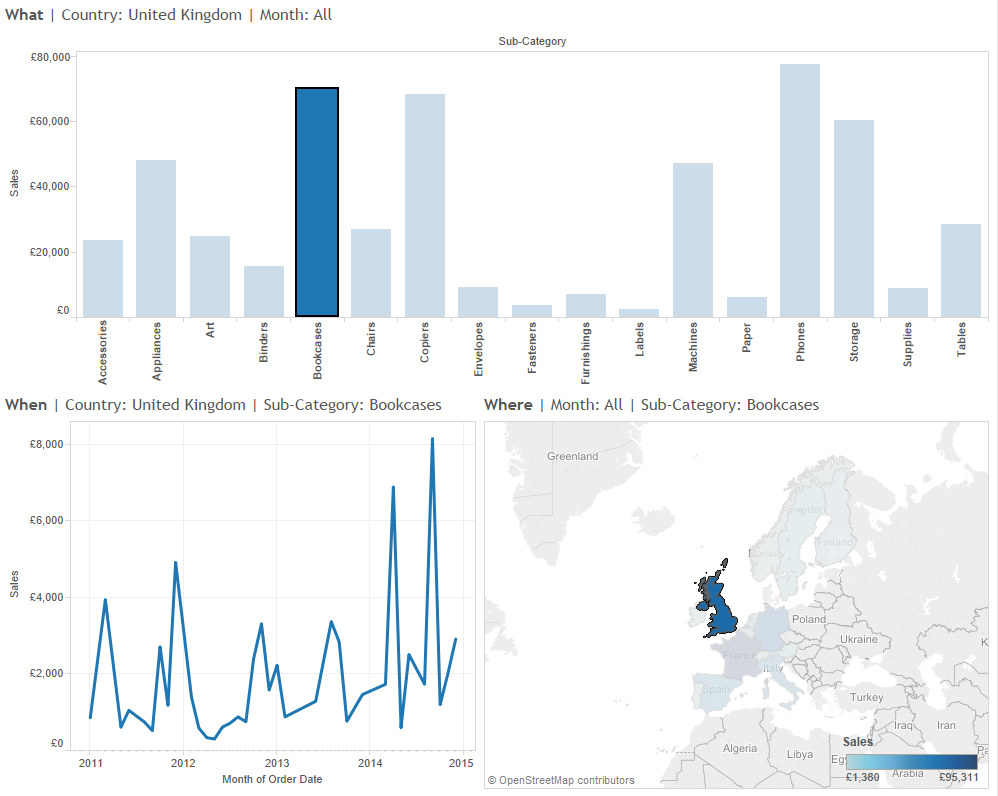 These titles change and reflect the filter values as users click around the dashboard - they even tell the user when 'All' is selected.How do we create it? I show you how in the video below.
These titles change and reflect the filter values as users click around the dashboard - they even tell the user when 'All' is selected.How do we create it? I show you how in the video below.