

10 July 2018
Analytical transformation, Europe-wide community, people looking for different outcomes when using Tableau.Those are the three mental notes I wrote down after my first day at the Tableau Conference 2018 Europe at the Excel Centre in London.As a recently ‘graduated’ Data Schooler last May, I was lucky to have been able to join my very first Tableau Conference. Many amazing moments and inspiring talks later it’s now time to step back and reflect on this experience.Below few highlights of TC18Europe from my perspective. Another notable talk was one from the special guest keynote, Garry Kasparov, covering the topic of Artificial Intelligence and how it is set to shape data scientists, analysts and the rest of the world. One interesting question posed to him by the audience was his view on what defines strategy and tactics.Strategy is about the future, trying to predict a solution for when there is not a problem.Tactics are to find a solution for the immediate problem in front of you.All the talks at TC18Europe were recorded and can be found on YouTube, I highly recommend going through the topics and pick out a few to watch.
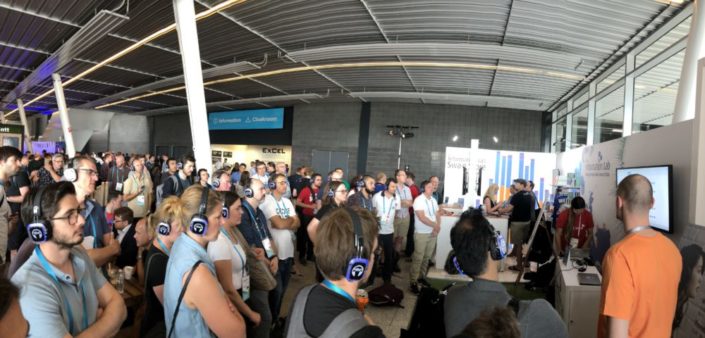 A great experience and hopefully our audience picked up on some new ways to use Tableau.Getting to speak to company’s using Tableau, Tableau employees, Tableau community, European colleagues and data enthusiasts is what really made this TC18Europe stand out. Which brings me to the last but equally important last topic, the Tableau community.
The Talks
I managed to sit on a different range of talks, from company success stories and key note developments to community usage and healthcare accomplishments.Rather than recapping each and every talk I would like to cover the different usage of Tableau that I came across. This goes back to one of my three mental notes ‘’people looking for different outcomes when using Tableau’’.- Dashboards.• Visual and story telling with data to convince, inspire or teach other people using Tableau as a visually attractive and interactive way to do so.
- Finding value drivers.• Searching for value drivers within our data to improve our products, specifically using Tableau’s power to pick up big and small trends.
- Answering questions.• World, business, scientific, social questions posed by people. Tableau comes in to connect to different data to try and answer these questions.
- Exploring data for insights.• Organisations continue to collect as much data as possible, Tableau is used to explore the unknown capable of fast analytics, cycling through different charts in a heartbeat.
- Training analytics.• New ways to show and analyse data, used to train analysts.
Another notable talk was one from the special guest keynote, Garry Kasparov, covering the topic of Artificial Intelligence and how it is set to shape data scientists, analysts and the rest of the world. One interesting question posed to him by the audience was his view on what defines strategy and tactics.Strategy is about the future, trying to predict a solution for when there is not a problem.Tactics are to find a solution for the immediate problem in front of you.All the talks at TC18Europe were recorded and can be found on YouTube, I highly recommend going through the topics and pick out a few to watch.The Expo Hall
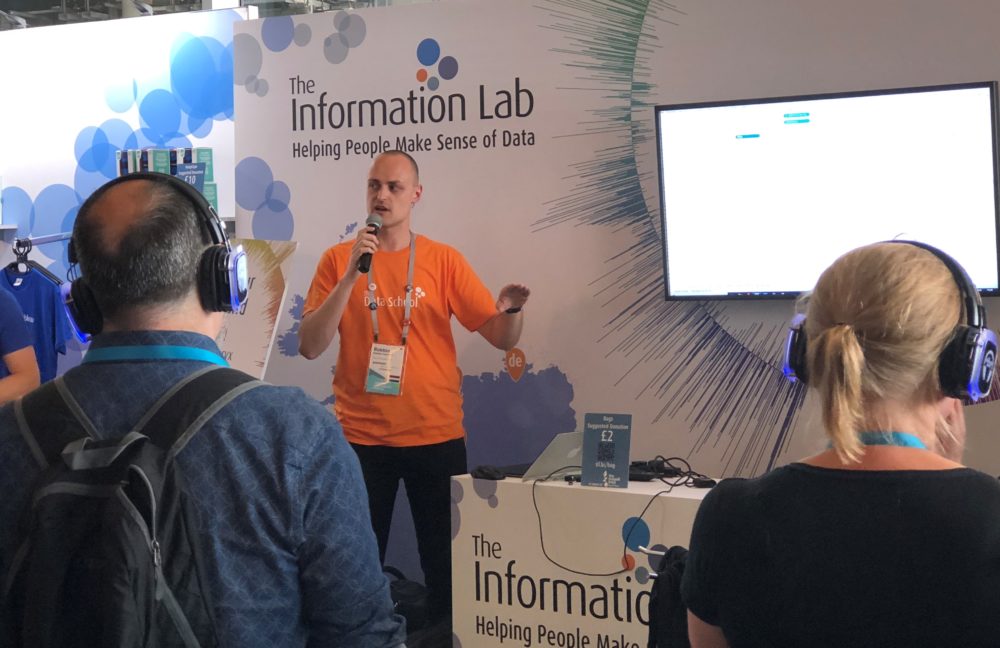
This is were I spend most of my time during the conference, either at the Data School stand or at the other booths.Why?Even though I was only scheduled to be there for ~2 hours, this is where I found I could learn most, answer community questions and expand my network. All of which I enjoy and find incredibly valuable.I was surprised by the vast amount of people attracted to our data school stand, and not just for the swag. Even though my Tableau consultancy experience is still young, a lot of people appreciated talking to us about our training and how we at the data school are trained and exposed with such a variety of client data.To an extent that we can understand what type of obstacles organisations can come across when trying to move away from traditional reporting to start to get measurable success from data analytics.I was also lucky enough to participate in a silent disco session with my fellow colleague @MinaOzgen. Nervous and excited at the same time, we set off our tips & tricks session, which attracted a big crowd, running out of headsets to hand out!A great experience and hopefully our audience picked up on some new ways to use Tableau.Getting to speak to company’s using Tableau, Tableau employees, Tableau community, European colleagues and data enthusiasts is what really made this TC18Europe stand out. Which brings me to the last but equally important last topic, the Tableau community.