Hello Tableau 2021.2! This latest version of Tableau has a lot of new features to make digging into your data easier for all users - and when we say all users, we mean it! From Collections for Server Admins, to Ask Data and Explain Data for Viewers Tableau 2021.2 has something for everyone.
While you can see a fantastic overview of 2021.2 features on Tableau's New Features page, we'd like to highlight our favourite new features, and break down how you can use them.
Desktop
For Desktop users this release boosts Tableau's geospatial capabilities with Area spatial calculation and Map layer control. We alo found an unpublicised update to the Show/Hide button that's left us grinning!
Area Spatial Calculation
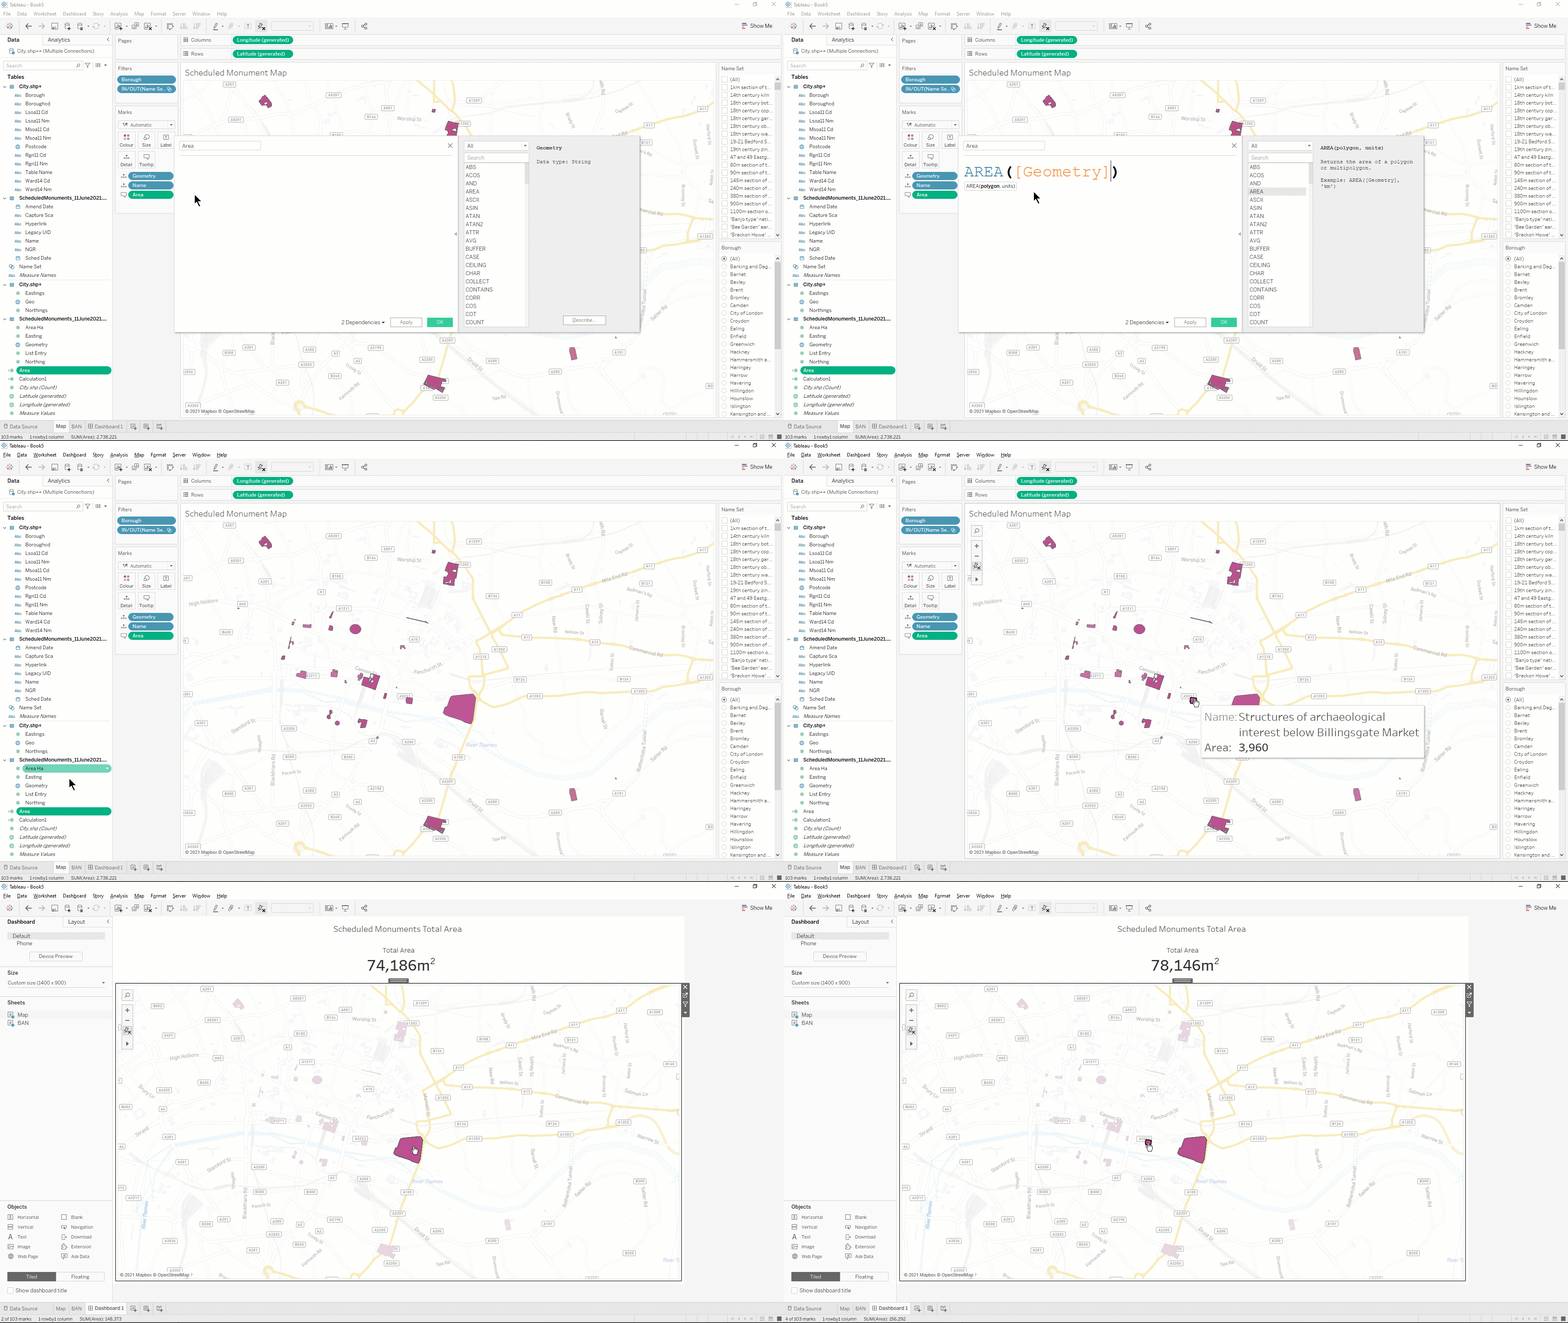
The area spatial calculation lets you calculate the square area (in metres, kilometres, feet or miles) of your selection on a map. This is a great feature for any users who need to do any spatial analysis on smaller areas (think calculating the area of green spaces for a city planner, or calculating the area of your warehouses for a manufacturer, but not calculating the area of a country). If you'd like to learn a little more about the development of the area spatial calculation check out this video by The Information Lab's own Tim Ngwena.

Show/Hide Buttons for Tiled Elements
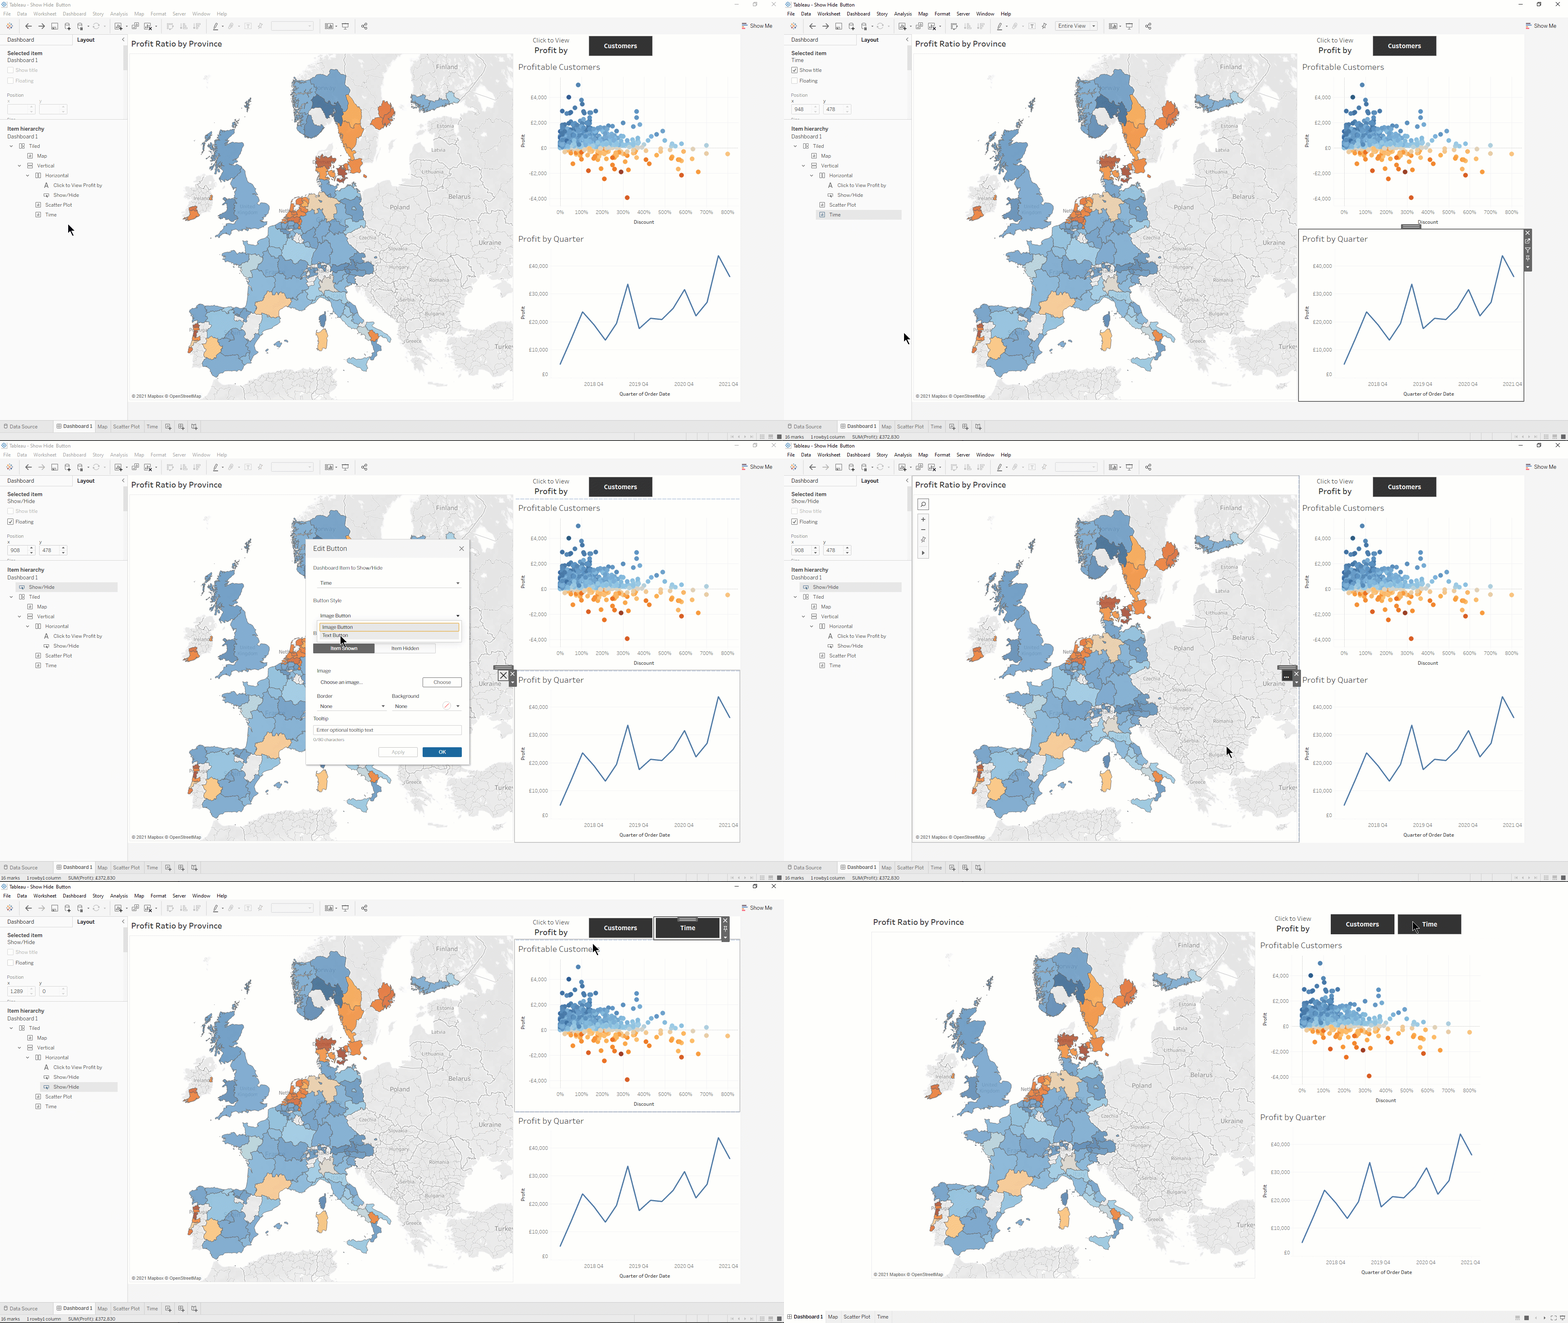
This hidden gem (not noted in any of the release documents) was discovered by our colleague Benjamin Schalk from The Information Lab Deutschland. You can now add the Show/Hide Button to Tiled elements on a Dashboard wherever they are (inside a container or not). As Benjamin put it 'Yay, simple Pop-Up-Charts just got so much easier!'

Server
A lot of the bigger-hitting features in Tableau 2021.2 are geared towards Tableau Server and Online: Collections and Explain Data and Ask Data for Viewers being the biggest of those. Keep on reading to dive deeper into these features.
Collections
This new feature gives you more fine-grained control over how you structure content in your Tableau Server or Online site. Users can create their own dedicated spaces on the server to add content. This content can come from various projects and workbooks. You could compare these collections with Apple Music or Spotify ‘playlists’ - they don’t take up any extra space but point to the original location of where these assets are stored.
Tableau Server on Linux in a Container
A much requested feature from Tableau Server admins. You can now run Tableau Server in a container! Containers are the de-facto way of rapidly deploying infrastructure in the public cloud and now Tableau follows this trend. Customer can now run Tableau Server on Linux in a single container. This can make deployments so much easier and faster.
Ask Data and Explain Data for Viewers
Ask Data, Tableau’s Natural Language experience is now available to viewers. This change let's every user on your Tableau Server or Tableau Online ask questions of their data in conversational English. This opens up your data to non-technical users.
This is the largest change to Ask Data since its release. It also includes some brand new UI and UX elements for users making it easier and faster to make queries.
Expanding the reach of Explain Data is really empowering for Viewers. Viewers want to understand the trends and nauences behind a data point, and now with Explain Data they have possible explanations to drive deeper questioning at their fingertips.
DataDev
Push updates to published Hyper files through the REST API
A really new and exciting feature added to the Tableau REST API is the ability to update published extracts. Pre-2021.2 it took developers five steps to keep their data fresh ( download a data source from the server, extract it, update the hyper, zip it back up, and re-publish the complete data source). In 2021.2 it now takes one step with the Hyper API: connect to published extracts and append / update rows. This is a very welcome update to the REST API and we can see quite a lot of new use cases.
Multiple Analytics Extensions per site
Prior to 2021.2 organisations couldn't configure more than one Analytics Extension per site. This meant if you had for example a Python model and an R sever running you couldn't use both on the same site. However, this problem has been solved! You can now use multiple analytics extensions on the same site so all your users can leverage advanced analytics and predictions from Python and R or configure multiple TabPy servers.
Lastly, make sure you also become a member of our Meetup group, we host regular events and deep-dives into new product releases.
