

29 June 2015
Another year on and we're into the third round of our data analysis experiment. For those who've not attended a London Tableau Conference (also known as TC On Tour) each year we challenge conference attendees to create a dashboard in Tableau which conforms to our specifications as fast as possible.We love showing Tableau to customers and prospects alike because it allows us to build from scratch, showing people exactly what it's going to be like for them to use in their day job. We love it so much many of us can do it in our sleep, but what about people who don't do it for a day job? What about those who just use Tableau as part of their general data toolkit, what even about people who've hardly ever used Tableau? Could they do it too? We wanted to find out. Yes I keep my conference badges[/caption]The first time we ran this back in 2013 we had no idea what would happen. Would people compete? Would they get frustrated that it took too long? We very quickly realised we had nothing to worry about! The top three times were all under 60 seconds, with the winning time a stunning 38 seconds. What blew us away though was the third place contestant had been using Tableau for just 48 hours, their first introduction was at a conference training session.[caption id='attachment_1764' align='alignnone' width='300']
 The winner Robert King[/caption]
 First time at The Brewery[/caption]We wondered about doing it again, could it get any better? Could we come up with a better competition? Well no! It was so fun, why would we change it. This time we got a little more organised with the final round a tense head to head between our top 3 contestants to determine the winner.[caption id='attachment_6269' align='alignnone' width='300']
 Yes that's now Info Lab employee Andy Kriebel he didn't work for us at the time[/caption]
 Don't worry about memorising it, we'll give you a template and hints along the way[/caption]As soon as you have your data build this dashboard:[caption id='attachment_6271' align='alignnone' width='300']
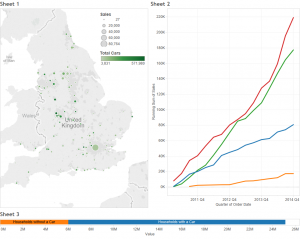 Click to view on Tableau Public[/caption]
 Click to view a video of what it can do[/caption]
Round 1 - 2013
[caption id='attachment_6266' align='alignnone' width='300'] Yes I keep my conference badges[/caption]The first time we ran this back in 2013 we had no idea what would happen. Would people compete? Would they get frustrated that it took too long? We very quickly realised we had nothing to worry about! The top three times were all under 60 seconds, with the winning time a stunning 38 seconds. What blew us away though was the third place contestant had been using Tableau for just 48 hours, their first introduction was at a conference training session.[caption id='attachment_1764' align='alignnone' width='300']
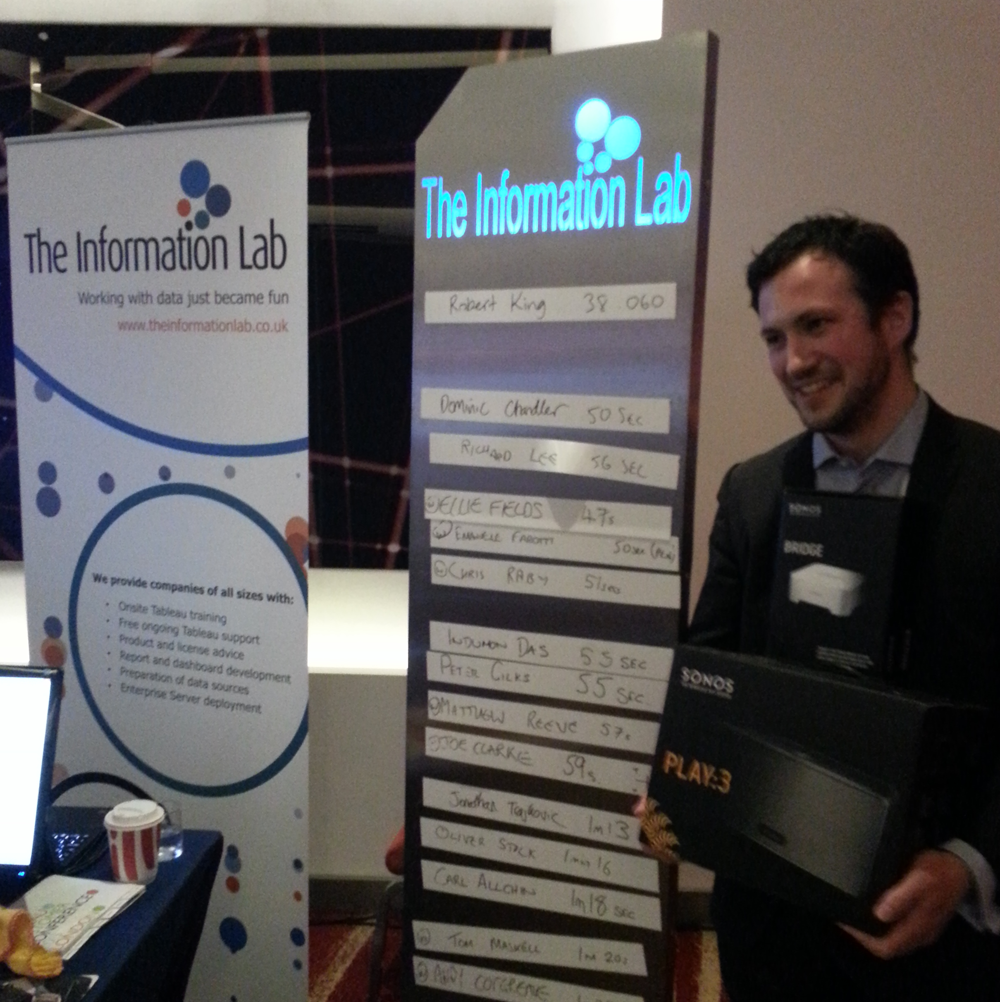 The winner Robert King[/caption]
Round 2 - 2014
[caption id='attachment_6265' align='alignnone' width='198']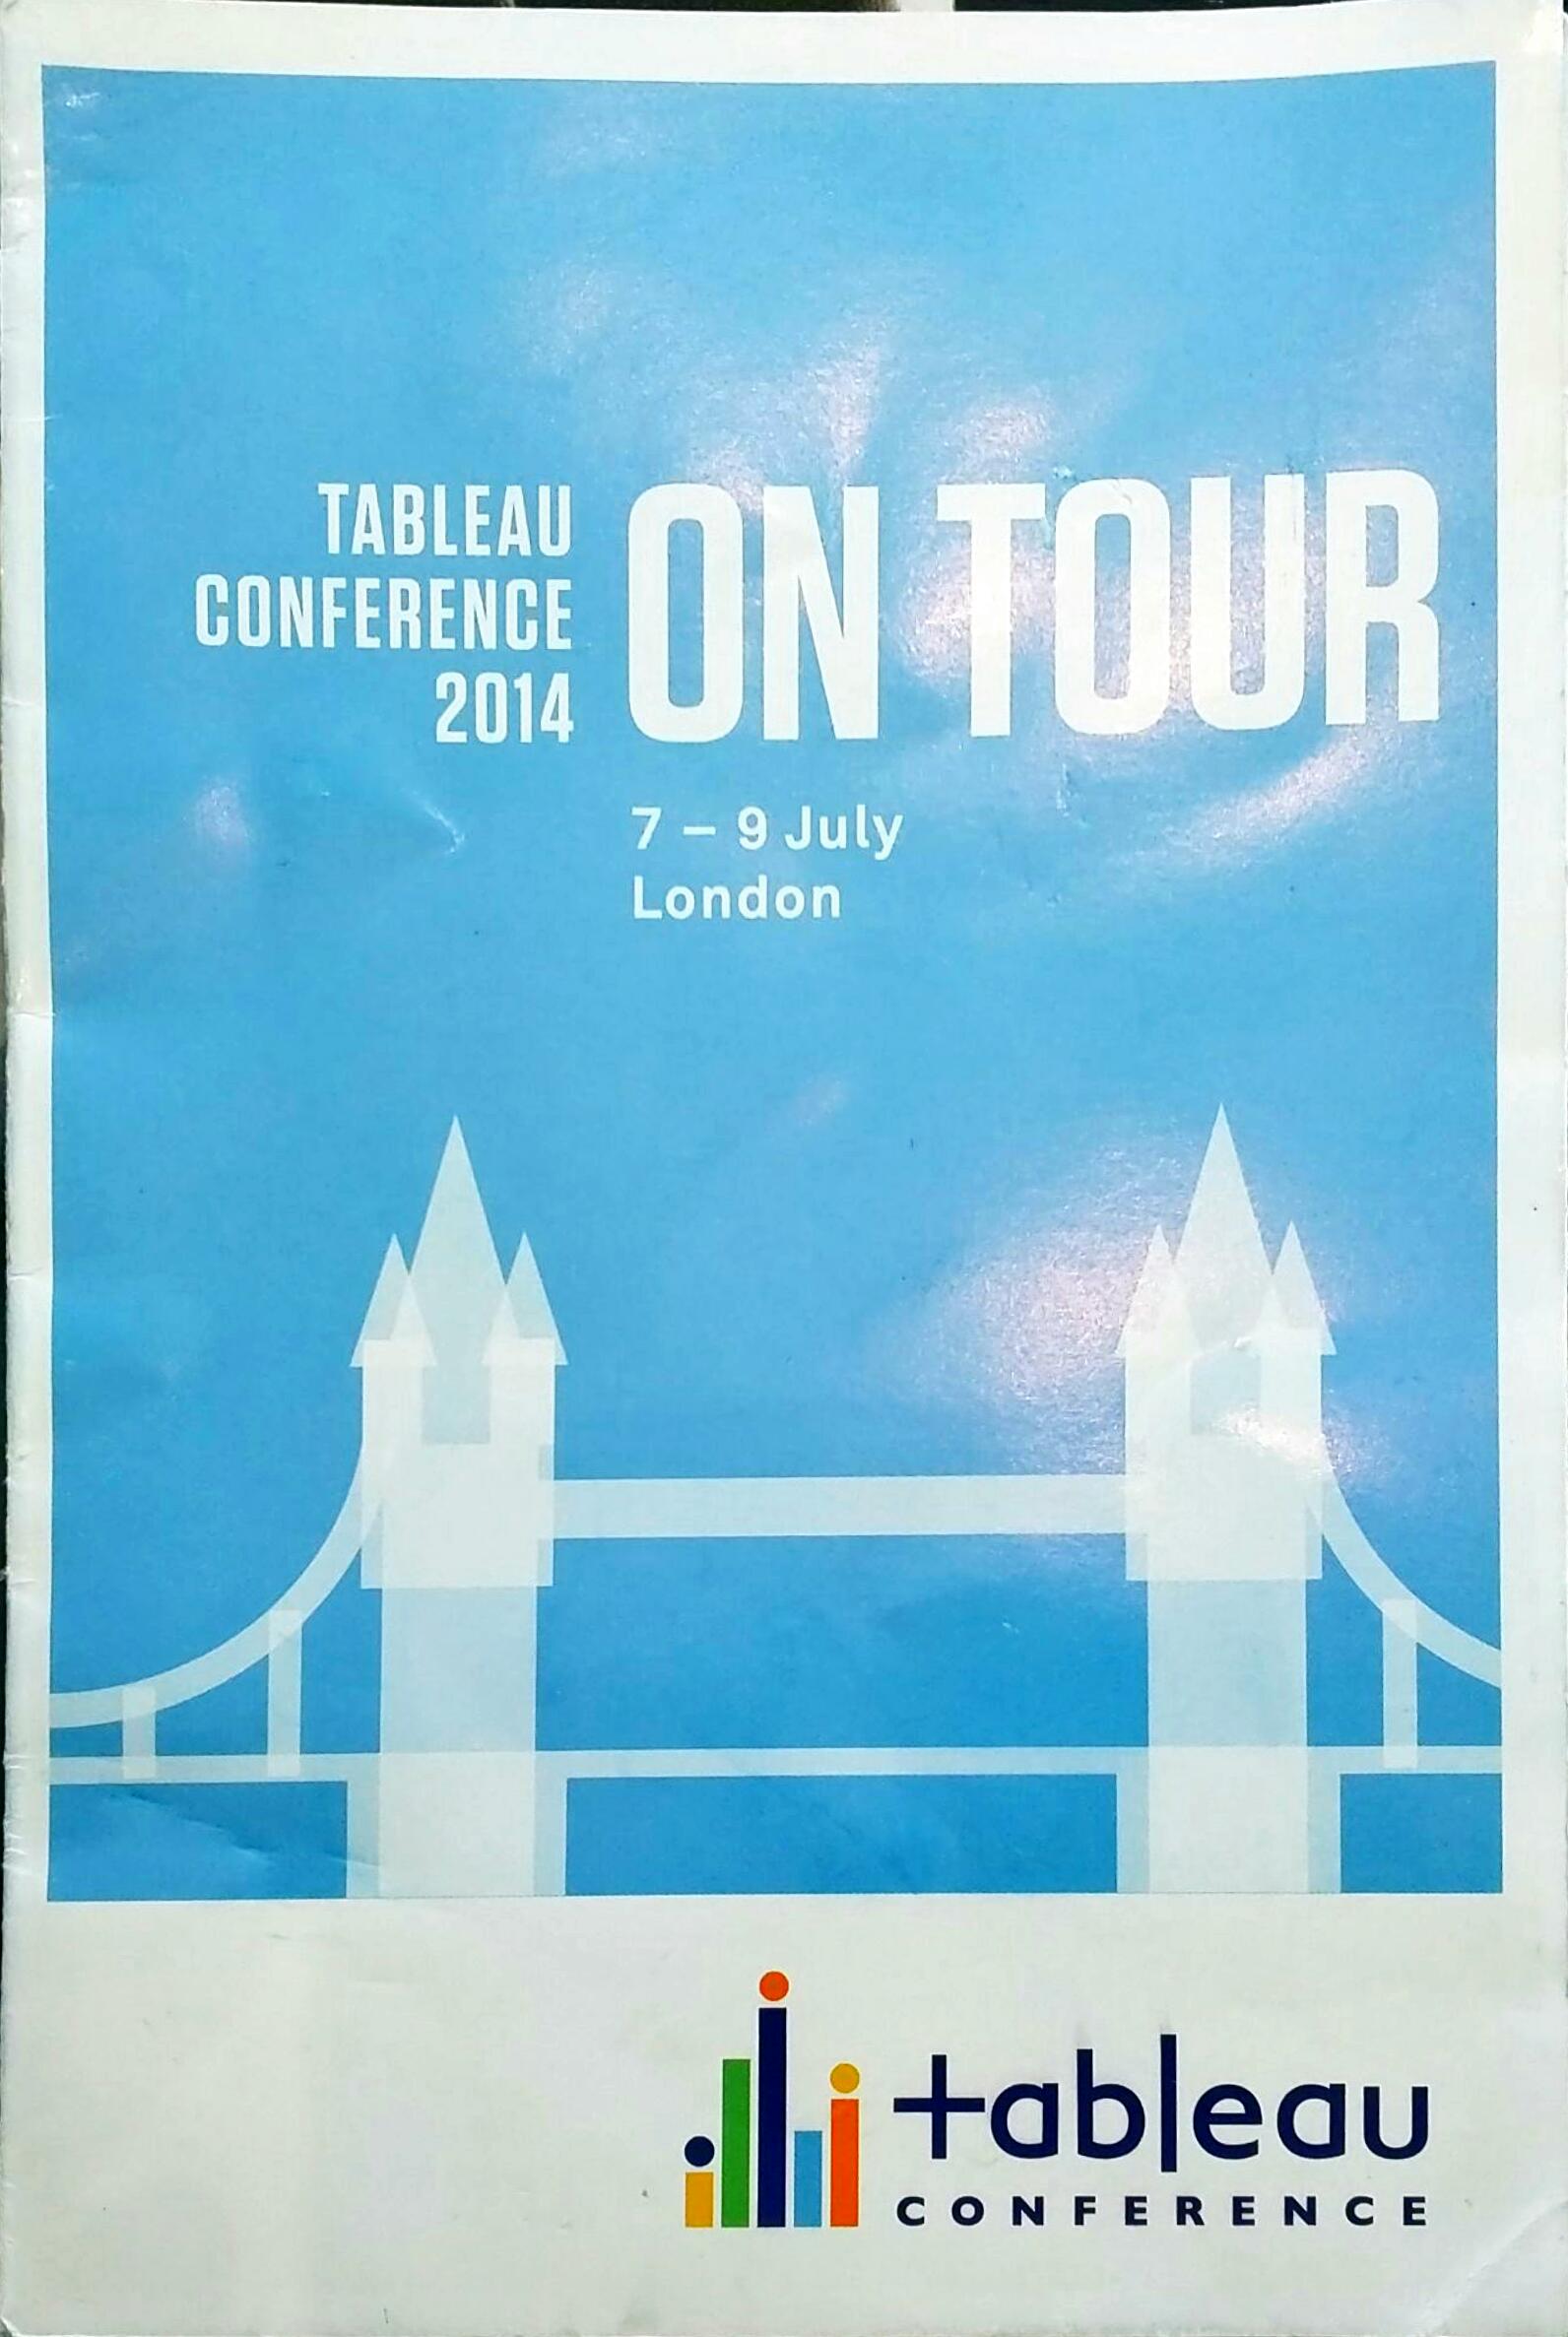 First time at The Brewery[/caption]We wondered about doing it again, could it get any better? Could we come up with a better competition? Well no! It was so fun, why would we change it. This time we got a little more organised with the final round a tense head to head between our top 3 contestants to determine the winner.[caption id='attachment_6269' align='alignnone' width='300']
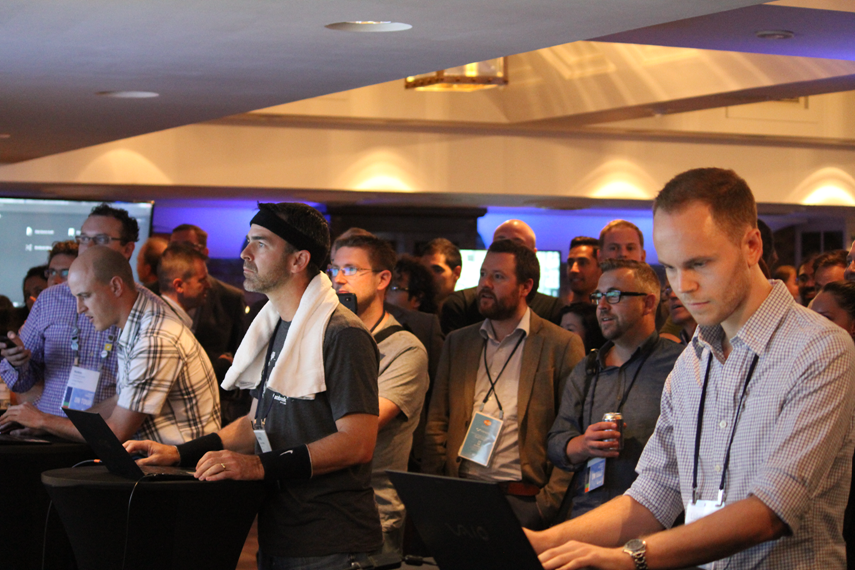 Yes that's now Info Lab employee Andy Kriebel he didn't work for us at the time[/caption]
Round 3 - 2015
And so here we are, TC On Tour is upon us again with Tableau bringing the party back to The Brewery in Central London. We're so excited this year not just to meet old conference friends, new customers and the rest of the Tableau community, not just because the speed challenge is indeed back for its third outing but because this time we've invited our good friends Alteryx to the game.Don't worry if you've never used Alteryx, or Tableau or even both. You're going to love trying to shave seconds off of your time, making those clicks as fast as your mouse hand can move.So what will you need to do?
As fast as possible you're going to build an Alteryx workflow, blending sales with census data and group the results into dynamic tiles (or bins you might like to think of them). Then output the results to a tde. Your module will look a but like this:[caption id='attachment_6272' align='alignnone' width='300']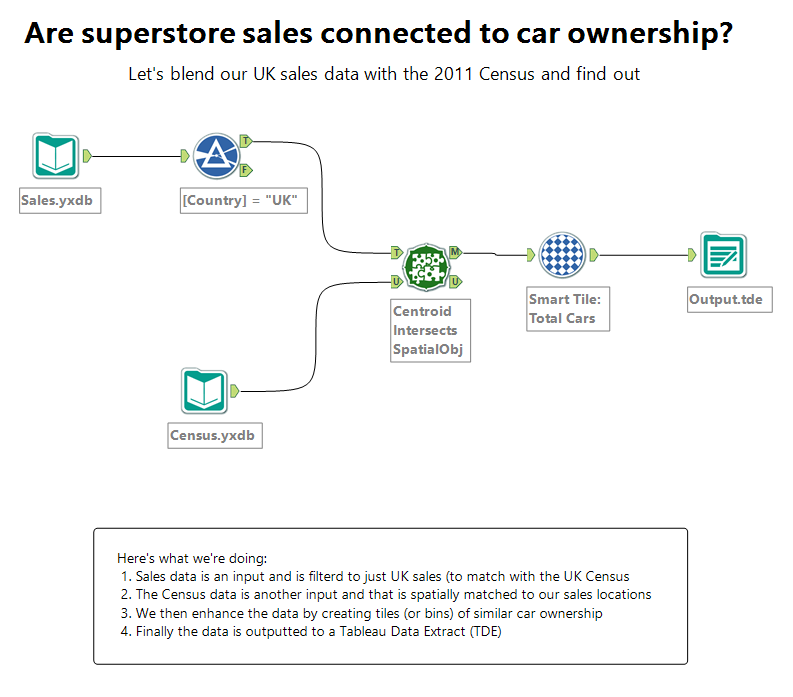 Don't worry about memorising it, we'll give you a template and hints along the way[/caption]As soon as you have your data build this dashboard:[caption id='attachment_6271' align='alignnone' width='300'] Click to view on Tableau Public[/caption]
What can you win?
We've never skimped on the prize for being the fastest data ninja around and this year is no different. The winner of this year's speed challenge will receive a Parrot AR Drone 2.0[caption id='attachment_6273' align='alignnone' width='300'] Click to view a video of what it can do[/caption]Want to be number 1? Practice!
If you want to be the fastest you might just want to have a practice. Here's everything you need:- Download trials for Tableau and Alteryx
- You can get the Tableau workbook from Tableau Public and the Alteryx workflow right here
- The sales data and the census data
- On the day all the Alteryx tools you need will be together in the 'Favorites' group
- When you output to a TDE in Alteryx you can click the blue link in the output window to go straight into Tableau
- On the Tableau dashboard we will require everything to be as in the example including positioning of charts and legends as well as the map set to 'Use as Filter'