


Peter's blog covered a lot of ways to generate dummy data in Alteryx, which I highly recommend reading if you're generating dummy data in Alteryx for the first time.
This blog covers a more complicated, more specific use case. How do you simulate or generate dummy data which has to have consecutive data points?
For example, let's say you're monitoring the temperature in your house, and you don't have the data yet, so you want to generate some dummy data. You want room temperature to be around 21 degrees celsius, although naturally the temperature will vary around that a fair bit. The problem with data measurements like temperature over time is that you can't simply generate random numbers within a range; if the temperature is 21.1°C at 16.42, and if it's 21.7°C at 16.44, then the temperature at 16.43 has to be between 21.1°C and 21.7°C. It's not going to be 24.6°C (or at least, it's incredibly unlikely that it would spike that high and drop that low again in such a short time).
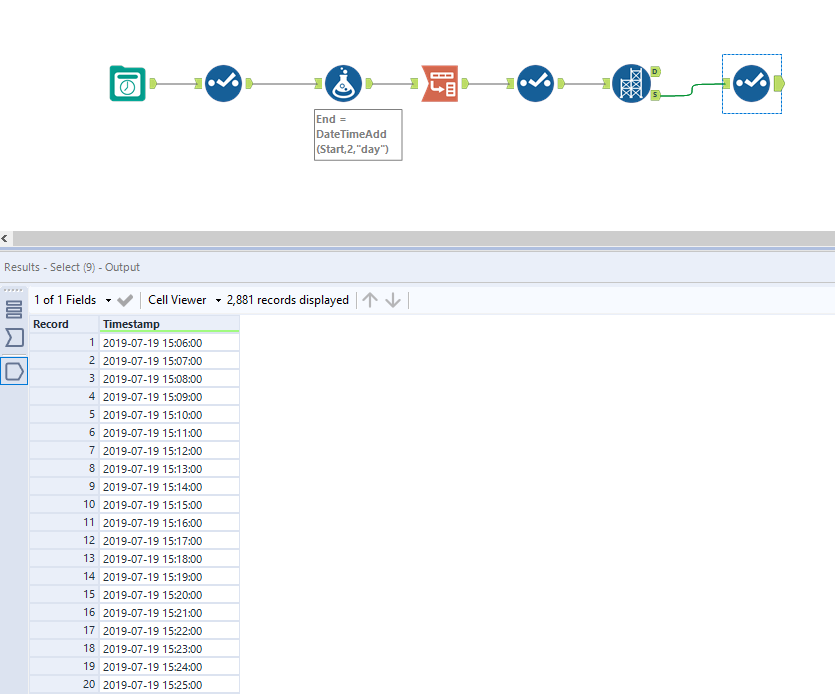
Let's start by creating a scaffold of data in one minute intervals. What I'm doing is taking the DateTime right now as my start date, adding two days to give me an end date in 48 hours, transposing it into one column, and then I'm using Ian Baldwin's useful DateTime Scaffolder macro to give me a scaffold of one minute intervals in that period.
At this point, we can add some simulated data. Let's let the temperature vary by 3°C around 21°C, so between 18°C and 24°C.
Now, if we used a regular formula tool with a random function, we could write something like this:
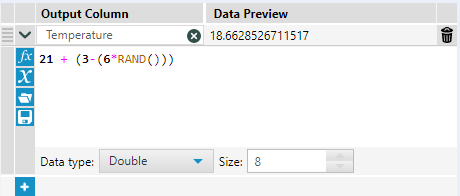
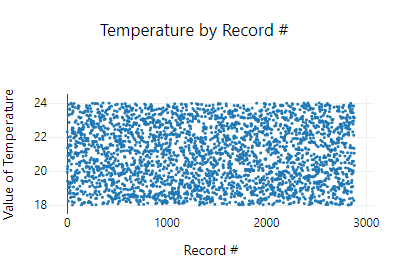
This gives us a flat distribution of random numbers between 18°C and 24°C . But the thing is, it creates a completely unrealistic set of temperatures. By definition, you have to pass through one temperature in order to get to a higher one, so having it jumping around randomly doesn't work. We can see that in the browse tool:
So instead, let's use a multirow formula tool to create a consecutive set of temperature readings that fluctuate randomly. The first thing to do is to add a Record ID tool so that we can identify each row. Then, we can set up a multirow formula, like this:
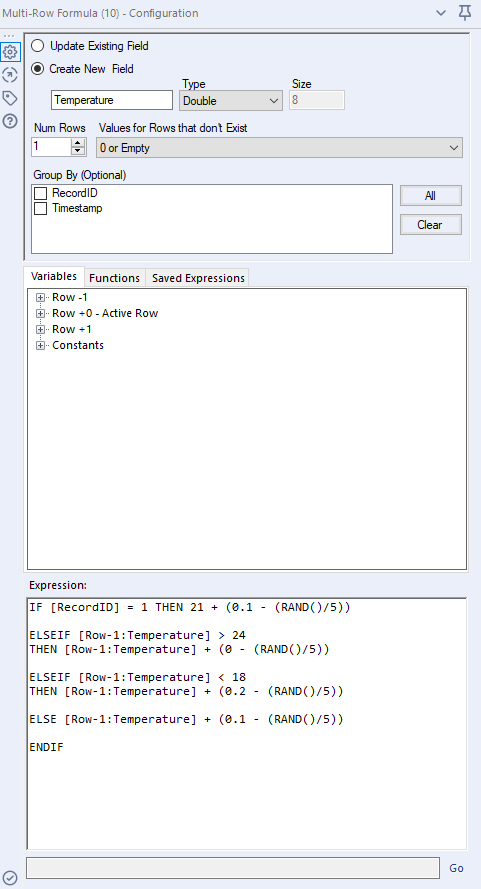
The first line will take the first row, and create a new field called Temperature, which will be a random number between 20.9°C and 21.1°C by taking the number 21 and adding a random number between -0.1 and 0.1.
The final line takes the previous row's temperature, and adds a random number between -0.1 and 0.1. This allows the temperature to meander around in a natural way, rather than spiking all over the place.
The lines in-between set the upper and lower limits; when the previous line is above 24°C, it sets it so that this line can only be -0.2 to 0 lower than that, and the temperature will trend downwards until it's below 24°C. The opposite happens for the lower limit; when the previous line is below 18°C, it sets it so that this line must be 0 to 0.2 higher than that, and the temperature will trend upwards until it's above 18°C again.
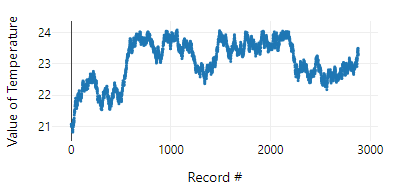
This time, the output in the browse tool is a far more realistic profile of temperature over time:
To conclude, if you're simulating data and need it to vary naturally and consecutively, use a multirow formula tool. You can set the step size of changes and set upper and lower limits quite easily, and the resulting measure will be pretty realistic.