

20 September 2017
In this quick tour, learn how to identify the data you need and how to use it to create your first ServiceNow dashboards in TableauIf you’re n user of ServiceNow IT Service Management (ITSM) and Tableau you might know that a beta version of ServiceNow connector was launched last March.Yeah, you can now open Tableau and directly connect it to your ServiceNow account (A full guide about what you need and how to connect is available here). As simple as that.https://twitter.com/drewdata/status/846775207515762689Once you connect to ServiceNow, you should find a series of tables, like in the image below. Knowing how to use them can be a bit intimidating if it is your first time using the data. For this reason I prepared two posts with some introductory tips about how to find the useful data after connecting to the service. You're reading the first part of the series. To access the second part, click here.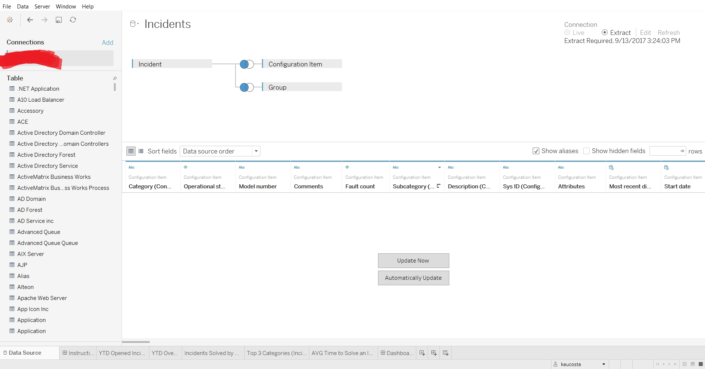
:: Tip 1:: Find the tables you really need
As the incidents analysis is one of the most common reports when talking about ServiceNow, let’s use it as an example. The first step is easy: the table holding the data about incidents is called “Incident”, so there are no secrets to find it.Other useful tables to have in mind are Problem, Request, User, Location and Group (use 'sys_user_group', as there are two tables called 'Group'), just to mention a few. They all have very obvious names, but it's difficult to spot them at a first glance in the ocean of tables you'll have access to.Problem and Request as well as Incident are part of the Tasks group, and, for this reason, they all share some standard fields as active, opened, closed, assigned to, description, escalation… In the following tips I’ll explore it a little bit more.:: Tip 2:: How to count the number of incidents
If you use Number of Records, chances are you’ll find the wrong number. It happens because the same incident can appear more than once – if it’s reopened or reassigned, for instance. The best thing to do is to COUNTD the unique ID given to each incident. You will find them in a field called “Number”.:: Tip 3:: Who did open the case? Who is the incident assigned to?
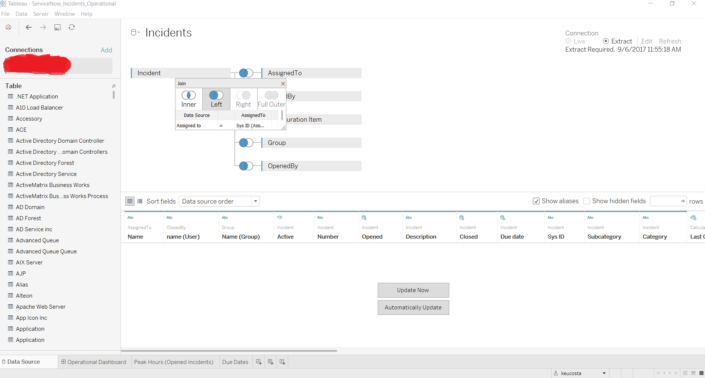
If you open the field “Assigned To” or “Opened By”, instead of a name you’ll find a weird value, the user sys-ID (System Identifier). The name you’re looking for is in another table called “User”. Everything user- related will be in the User table.It means that if you’d like to show both the name of the person who created the incident and the name of the person the ticket was assigned to, you’ll need to join the “User” table twice, one for each value.When doing this, remember to rename the connection – for instance, call one “Assigned To” and other “Opened By”. Otherwise chances are you will have errors when trying to either refresh or use the data.