

Tableau is already an amazingly powerful tool and TabPy makes it even more powerful by allowing you to run Python scripts.
There are many uses cases for using Python in Tableau, in this post we'll go over how to do sentiment analysis.
What is sentiment analysis?
Its a form of natural language processing (NLP) which tries to determine the emotion conveyed in text. Simply explained, most sentiment analysis works by comparing each individual word in a given text to a sentiment lexicon which contains words with predefined sentiment scores.
For this example, we'll be using the VADER lexicon which was developed to be specifically attuned to sentiments expressed in social media. That also makes it quite useful for analysing other informally written texts.
How to use TabPy
If you have not set up TabPy before, see this article.
Once you have TabPy server up and running and connected to Tableau we need a dataset to test this on. For this example, we'll be using Billboard top 100 songs from 1964-2015 which you can get here.
After importing the data set we can start using TabPy, we do this simply by writing standard Python code into a standard Tableau calculated field with some syntax to connect the two.
Here is the code we will be using:
SCRIPT_REAL('
import nltk
from nltk.sentiment import SentimentIntensityAnalyzer
text = _arg1
scores = []
sid = SentimentIntensityAnalyzer()
for word in text:
    ss = sid.polarity_scores(word)
    scores.append(ss['compound'])
return scores
 ',
 ATTR([Lyrics]))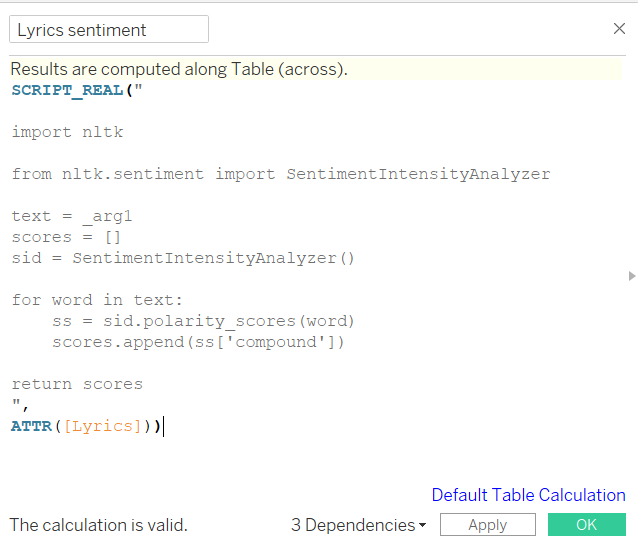
The first thing to notice is the script function.
There are 4 different script functions, one for each type of data:
- SCRIPT_INT - for integers / whole numbers
- SCRIPT_REAL - for real numbers / decimal numbers
- SCRIPT_STR - for strings / text
- SCRIPT_BOOL - boolean / true or false
These script functions specify the type of data you want to output (return) from the calculation.
Since we want to get a sentiment score which ranges from -1.0 (very negative) to 1.0 (very positive) we want to use the SCRIPT_REAL function to return decimal numbers.
In the script function, we have standard Python code with two modifications for Tableau.
- We have to specificy the 'return' variable in order to get data out from the function.
- Arguments such as _arg1
The key to connecting Python to Tableau is using arguments and Tableau fields. You can specifiy as many arguments are you like, _arg1, _arg2, _arg3...
These arguments will then be mapped to Tableau fields in decending order.
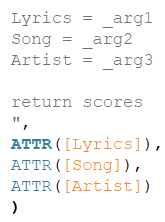
In our example, we only needed one argument called text which we mapped to the lyrics Tableau field. The reason why the lyrics field is wrapped in the ATTR function is because we only want to analyse one lyric at a time. The ATTR function, which stands for attribute allows us to select only one lyric from the lyrics column.
What are the limitations of TabPy?
One thing to keep in mind when using TabPy is that it will be a Tableau table calculation. This creates some limitations:
- The script will only run when you put it into the view
- You cannot use the calculation to create values and base further calculations on those values unless you can both calculations in the view.
- If you are using a large dataset you might be waiting a long time while the script runs each time you make a change to the view.
- The Python generated data will not be extracted if you create a Tableau extract.
Creating a dashboard
You can use the table calculation just like you would any other Tableau table calculation to build your views.
Here is a finished dashboard using static data on Tableau Public.
You can download the dashboard containing the python code here.