

One of the great things about Alteryx is that you can quickly generate ideas or sketches of logic to test a theory or prove a concept on the fly. Recently, I needed to do this when helping someone with one of their Alteryx workflows, and they were impressed by a trick I used to quickly generate some fake data to test that concept, so I thought it worth sharing.
Why might you need to do this? I can think of a couple of reasons this might be useful:- You may not have access to a final production data set and might just want to get a draft concept working before switching over to your master data. You may be training other people in Alteryx and you don’t have quite the necessary sample data to hand to demonstrate something with. You may need to create scaffold data within a workflow to supplement your actual data in order to solve a data modelling problem. You may want to share a piece of work but the real data is just too sensitive so a fake placeholder dataset could help. The concepts detailed below will be useful in many scenarios, not just generating fake data.
So what do we need to do?
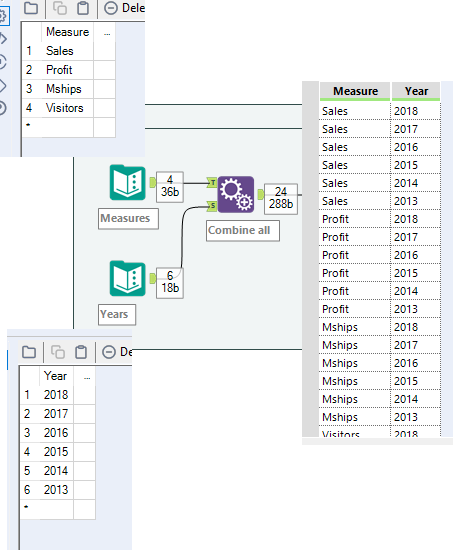
I had just a little reshaping challenge to do, so I knew what the key measures were, with just one date dimension, you can whack these in the handy text input tool, use an append tool to perform a cartesian join to get all combinations of your dimension values, and measure names. (If you have more dimensions, you’d need to do another text input and append tool for each.) At this point I’ve kept the measures in one column so I can generate values for them all very quickly.
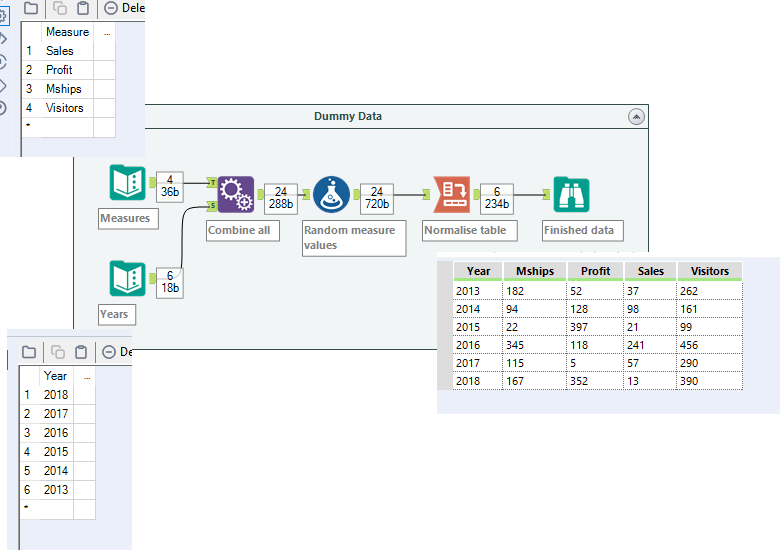
Now to generate the numbers, this is simply the use of a formula tool and the Random Integer function. A quick cross tab of the measure names then creates a useful normalised data table that I can work with.
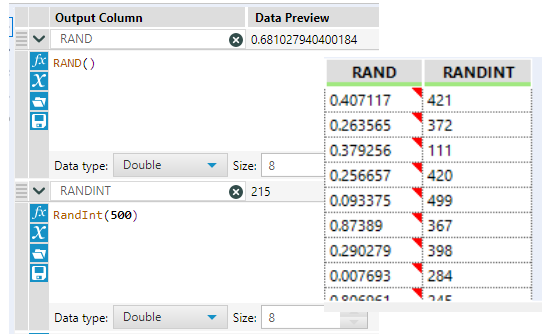
You may wonder why I used the random integer function rather than the random function, and this is because the random function gives you a random number between 0 and 1 so all numbers are decimals, whereas with the Random Integer function, other than all being integers, you can specify a maximum value, which gives you a little extra control over your values.
Upping the Complexity
This got me thinking, you could then make this much larger and generate some really useful data sets, if you needed to, and although my data was easy enough to mock up by tapping in a few cells of data, what if you wanted to dynamically generate data based on a few rules or limitations? After a quick search on the alteryx community I found a question with a really helpful answer by James Dunkerly, which is certainly worth breaking down and sharing.
Generating Measure Values Within a Given Range
Using the Random functions listed above, we can easily force our measures to be within a certain range; we need only to use them appropriately in the formula tool as such:
RandomInt( [MaxValue] - [MinValue]) + [MinValue]
And if you want it to be a decimal, why not throw on +Rand() to the above formula too.
Generating Dates Within a Given Range
The generate rows tool is great for mocking up data - take note of the grey input anchor, this means that an input with incoming data is not required. We can use incoming data in the logic to generate additional rows, or we can start with nothing and generate rows as we desire. In this example we choose a start date in the intialisation expression (ie start with this value)
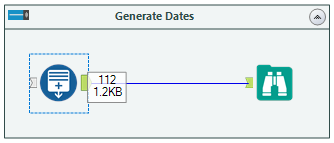
I like to think of the generate rows tool in 3 steps (in a slightly different order to how the tool is presented but, each to their own…)
- Initialisation Expression - Start with this value (or expression to create the first value/row)
- Loop Expression - Perform this function on the initial value/row to create a new row (and continue...)
- Condition Expression - Do the same again until such time that this expression is false, then stop generating new rows
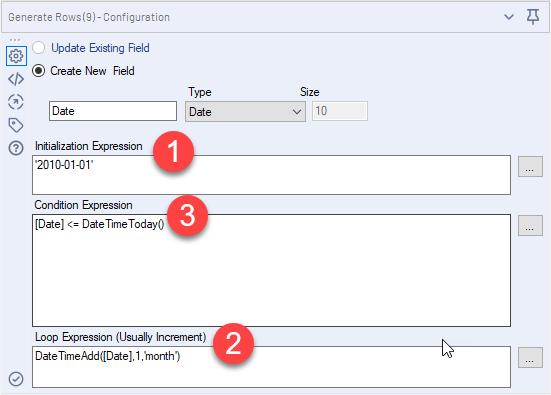
The above example will then start with the date '2010-01-10' as the first row, then add a new row with the date one month later, until the final row equals the month of today's date (truncated to the first of the month).
Bringing it all together
Hopefully you've nailed the basics from above now and can whip up basic datasets to your heart's content. However, we could get a bit meta here and combine the techniques above for a more realistic set of data. By this I mean instead of creating uniform complete sets of dimensions by using cartesian joins, we could randomise the generation of the dimension sets.
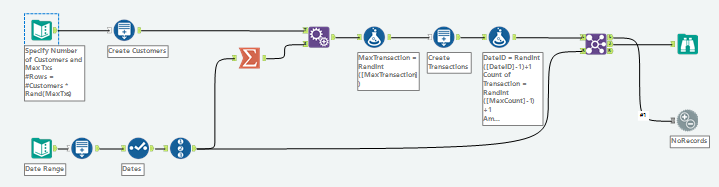
Randomising Record Count per Member of a Dimension
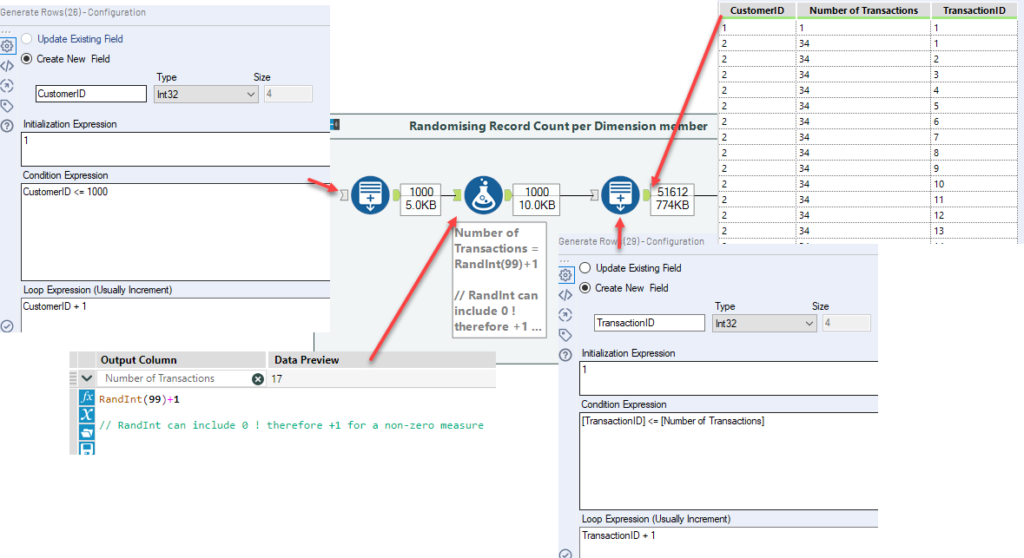
Take for example, customers and transactions. Let's say we want a dataset of one row per transaction per customer. In genuine data, not all customers will have had the same amount of transactions. So to generate data that is helpfully realistic, we can use the random function to generate rows that represent transactions.
First, we generate a list of Customer IDs up to a defined maximum, then, for each we generate a random integer, which is the number of transactions, thus new rows we require. We then use a second generate rows tool to generate these additional rows.
Randomising Dates
Again, a combination of these tools can help use randomise date data too.
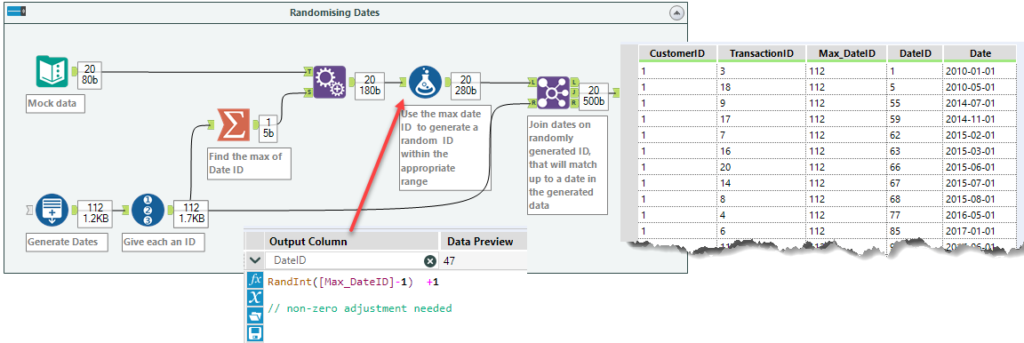
First, generate the desired date range using the steps outlined above, then give each a record ID, and find the maximum. Append this maximum value to the data that needs random dates applied to it, and then use a formula tool to generate a random integer within the range of the number of dates available.
Finally, join based on this randomly assigned integer, such that all data points receive a random date.
Combining all these concepts can give you a helpful fake dataset pretty quickly, be it for proving a concept or building a dashboard before your final data is ready, I hope you find this useful for your own use case.
The workflow is available here to have a play around with for yourself.
Feel free to reach out on twitter or comment below with any questions!