


With Project Griffon, we want to share examples and started with you – the Tableau Community. The objective here is to share tools which use what you have in front of you to help explain more about what’s going on. Please be sure to read the introduction to Project Griffon, and ensure that you have access to the Tableau Server Repository via the Postgres connection.
One of the key reasons for starting Project Griffon was to improve on the built-in Administrative Views of Tableau Server.
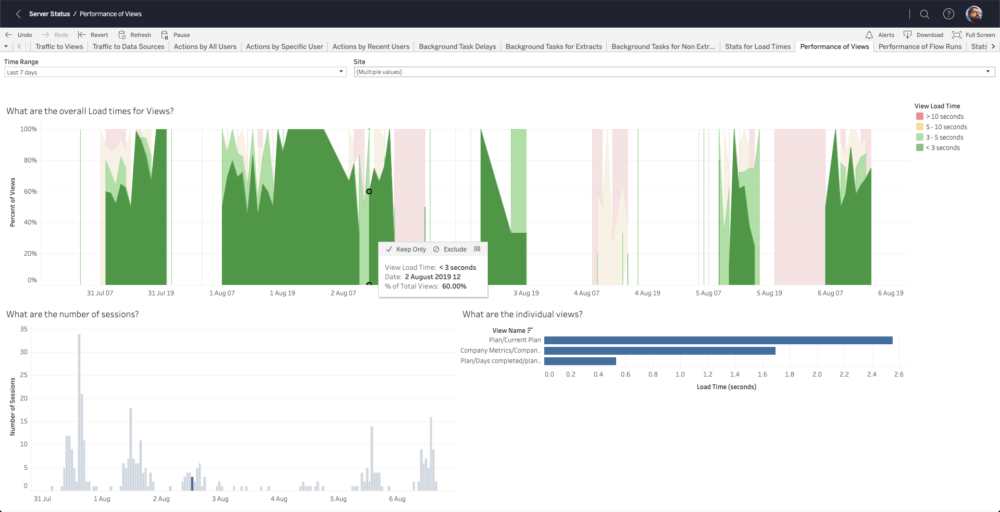
This latest post will focus on the Performance to Views tab, and this is effectively a makeover of that. One of the key questions that tab focusses on is the overall load times (ie. the time it takes to load up individual views/sheets in a Tableau workbook) and also the number of active sessions (to see if concurrent sessions is impacting the load times)

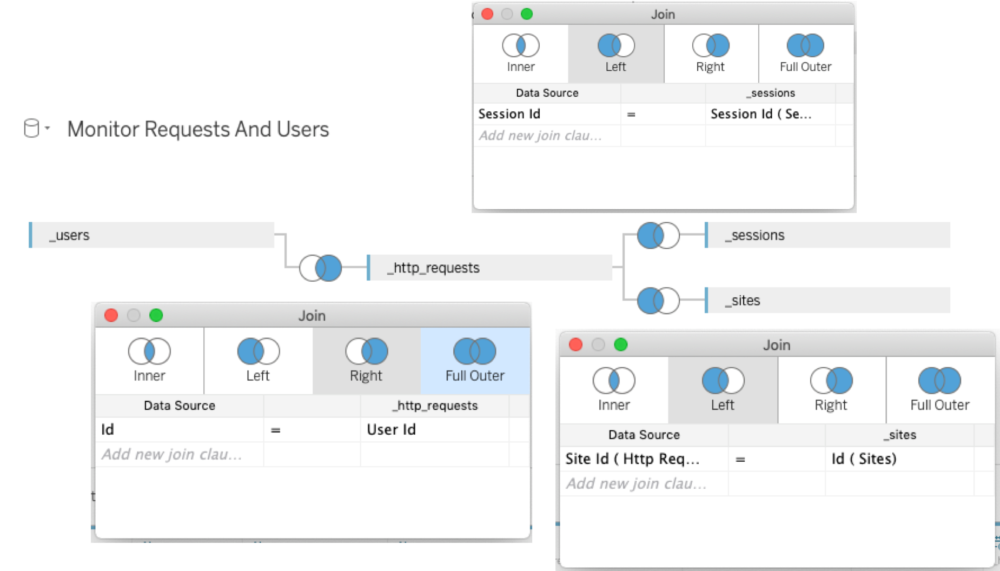
For this, I'll be using the actual dashboard itself (grabbed from this workbook: https://www.theinformationlab.co.uk/2019/03/14/project-griffon-admin-views-from-tableau-server/ ) The datasource used is the 'Monitor Requests & Users' source which is pre-built in the admin views workbook. The join image is below.
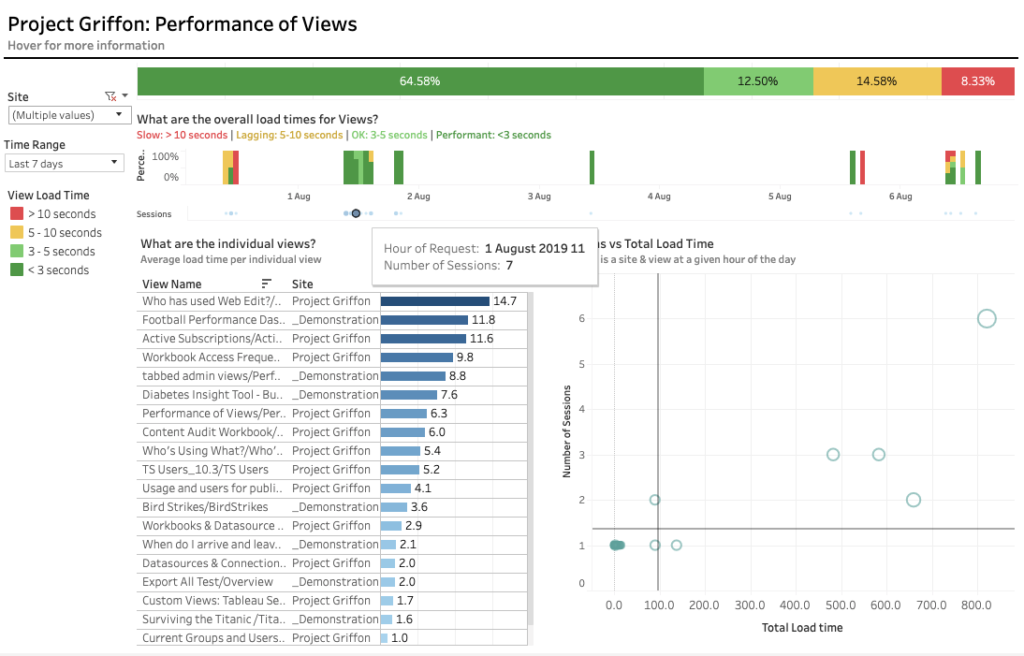
So what did we build?
The current workbook was fine in terms of what it showed, it just needed a bit of organisation and sprucing. So some elements were rearranged, and then gave it a Project Griffon makeover. I appreciate there may be some issues with the RAG colour status, but this is easily changeable once you download the workbook.
Find the workbook below, ready for you to use!
Don't forget to change the repository details in the datasource details window, adding your password of course.

Please do share your feedback and experiences, and stay tuned for more #ProjectGriffon goodness!