

Market Basket analysis is a way of looking for things that people buy at the same time (or that people never buy at the same time) in order to spot trends in people’s behaviour. For example, it’s probably obvious that if somebody buys cereal, they’ll probably also buy milk. Or that if somebody buys tofu, they’re probably not going to be buying sausages. But the interesting patterns are the ones that you wouldn’t necessarily assume go together.
A famous, although kinda apocryphal, example is of beer and nappies at a supermarket. Another example which you can see for yourself on large internet retailers is a link between miniature Lego shovels and scales which are accurate to the 0.01g level. This probably isn’t the consumer behaviour that Lego were intending, but it is a good demonstration of how and why people buy things.
How to do market basket analysis in Alteryx has been covered before, so this blog is about how to apply it to different things. The great thing about market basket analysis is that it’s ultimately a way of looking for things that occur together, and that doesn’t have to be transactional data.
In another blog, I looked into the politics of Eurovision voting using market basket analysis. This can help identify whether a particular voting tendency is reflective of a wider pattern, or specific to two countries. For example, Greece and Cyprus always vote for each other and give each other lots of points. But market basket analysis shows that this isn't a wider trend; other countries aren't more likely to vote for Greece if they have already voted for Cyprus. However, this kind of wider trend does exist for the Nordic countries. Denmark and Norway tend to vote for each other pretty often, and they tend to give each other average to high scores. This tendency is also reflected in the wider European voting patterns; if a country votes for Denmark, they're likely to vote for Norway too, with a lift of 1.23. This is an interesting way of looking for patterns across collated sets of votes.
In this blog, I'm going to look at another way of using market basket analysis to find patterns in my Spotify listening data to look at which bands I tend to listen to together. Instead of looking at individual transactions with various items in my basket, I can look at individual days of my listening habits. If on Monday I’m working on a complicated Alteryx workflow, I’m probably going to be listening to post-rock and/or blackgaze, and probably full albums. That means that’ll be one day with lots of songs by not many artists. If on Tuesday I’m at the gym, I’m probably going to be listening to post-hardcore on my gym playlist of individual songs, which means that’ll be one day with some songs by far more artists. Some of Monday’s and Tuesday’s artists might overlap. If on Wednesday I’m doing even more difficult Alteryx work and then working it off at the gym in the evening, that’ll be a day with a far bigger overlap of artists.
So, I can wrangle my data from this format:

To simplify the dataset into this:

Before getting into the market basket analysis, it’s nice to see that this is an example of a real life Pareto - about 80% of my listening is from 20% of artists.

Anyway, I then use the MB Rules and MB Inspect tools as follows:

In the MB Rules tool, I’m putting the support filter down as low as 1%, because there’s a long tail of artists, and then putting the confidence filter to 30%. I’m not setting any additional filters within the MB Inspect tool.
That’s pretty much it! The interesting bit is the insights that come from it.
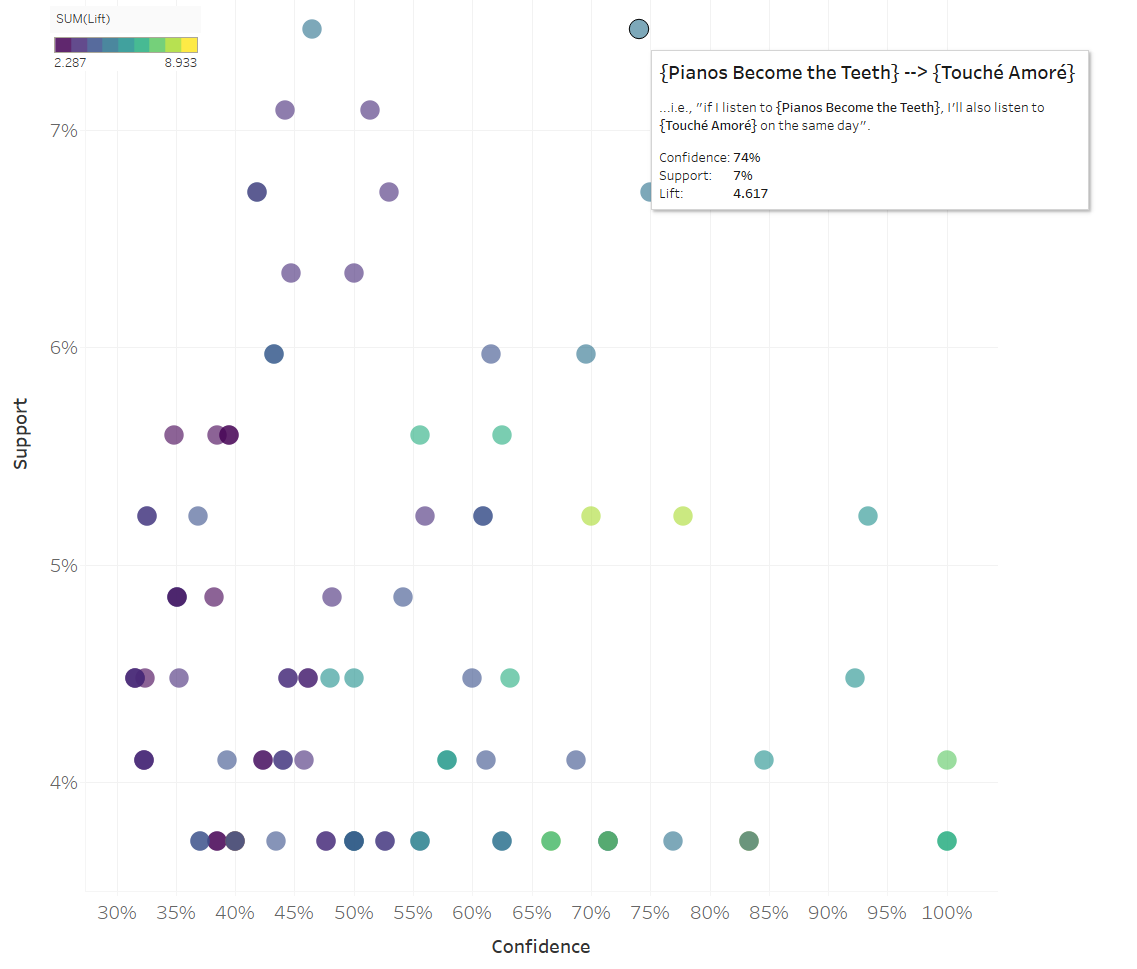
Here’s a scatterplot of confidence and support for the association rules in my listening history. The association rule on the top right is Pianos Become The Teeth → Touche Amore, i.e., if I listen to Pianos Become The Teeth, I often listen to Touche Amore on the same day. This association rule has the highest support and very high confidence, which makes sense; the year filter is taking streams from 13th May 2018 onwards, and neither band released an album in that period, so this is the co-occurrence of two of my all-time favourite bands in my general listening habits.

There are some other, less likely rules. For example, Death Grips (kind of experimental rap with blast beats) and Alaskan Tapes (slow chilled-out soundscapes that I use to fall asleep on public transport) don’t go together. At all. So why do I have an association rule that says that if I listen to Death Grips, I’ll also listen to Alaskan Tapes with a lift of 8.38? If you were only looking at lift, then this sounds like a great pair of bands to put together at a gig or festival, but they’re really, really not.

When I delved back into the data, the days that I listened to both bands on the same day were on three consecutive Fridays, and it was a different song each time. It looks like this is from listening to Spotify’s autogenerated Release Radar playlist, which comes out every Friday… and sure enough, both bands had albums come out around this time in summer 2018.
So, not only can market basket analysis pick up on my intended listening behaviour like my preferences, it can also pick up on my accidental listening behaviour based on choices that have been made for me - I’ve listened to those two bands on the same day three times, not because I necessarily chose to, but because Spotify’s algorithms thought I should listen to those bands when looking for new music. You can probably tease out the differences between intended and accidental listening behaviour like this by looking for patterns (or lack thereof) in the dates and in the songs. Spotify are presumably (and hopefully!) doing this somewhere on their end in order to ensure that my passive listening to their playlists isn’t simply reinforcing the algorithms they use to generate the playlists. But, I'm not sure that they are.