

3 February 2016
Welcome to another installment of the LoD blog series; aiming to show how LoDs can be used to make your viz more dynamic and interactive. This blog uses a similar technique to the previous blog, where a dimension is created as the result of a fixed LoD calculation.In this example I'm going to add a LoD calculation to a hierarchy, enabling drill-down interactivity to better understand my data. I’m going to use this trick with the Superstore data to explore product profitability. I want to investigate which Categories, Sub-Categories and Manufacturers have sold more unprofitable products and which have sold more profitable products.The first step is to create a LoD calculation that creates a group for unprofitable products and another for those that have made profit:First fix the calculation to the product level: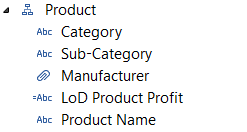 Adding this calculation to any level in a hierarchy will allow the ability to drill-down and explore profitability at any level. This will allow you to easily drill-down into which manufacturers have more or less unprofitable products.
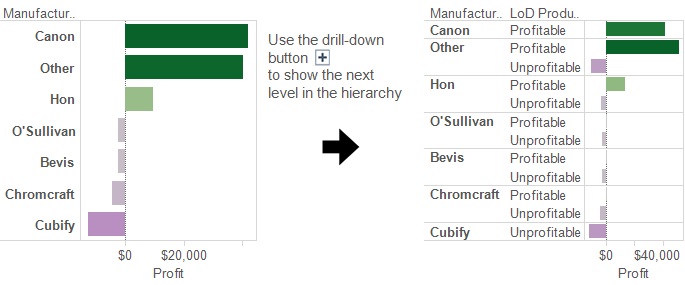 Here's a link to a workbook that contains a dashboard with a few charts enabling drill-down capability, increasing interactivity and further developing understanding of product profitability:LoD in a hierarchy
- {fixed [Product Name]:
- {fixed [Product Name]: Sum([Profit])
- if {fixed [Product Name]: sum([Profit])} <=0 then 'Unprofitable' Else 'Profitable' END
Adding this calculation to any level in a hierarchy will allow the ability to drill-down and explore profitability at any level. This will allow you to easily drill-down into which manufacturers have more or less unprofitable products.Here's a link to a workbook that contains a dashboard with a few charts enabling drill-down capability, increasing interactivity and further developing understanding of product profitability:LoD in a hierarchy