

In my latest client engagement I was working with a client to allow them to understand there performance at the lowest level, against a set of higher level benchmarks.
In Sample-Superstore terms, my Sub-Category managers, wanted to understand how they were performing against others in there category, and others within the group as a whole.
They also wanted to benchmark there performance against the previous year too.
In this post, I will highlight how a few simple LODs can help us perform this benchmarking process.
The End Game
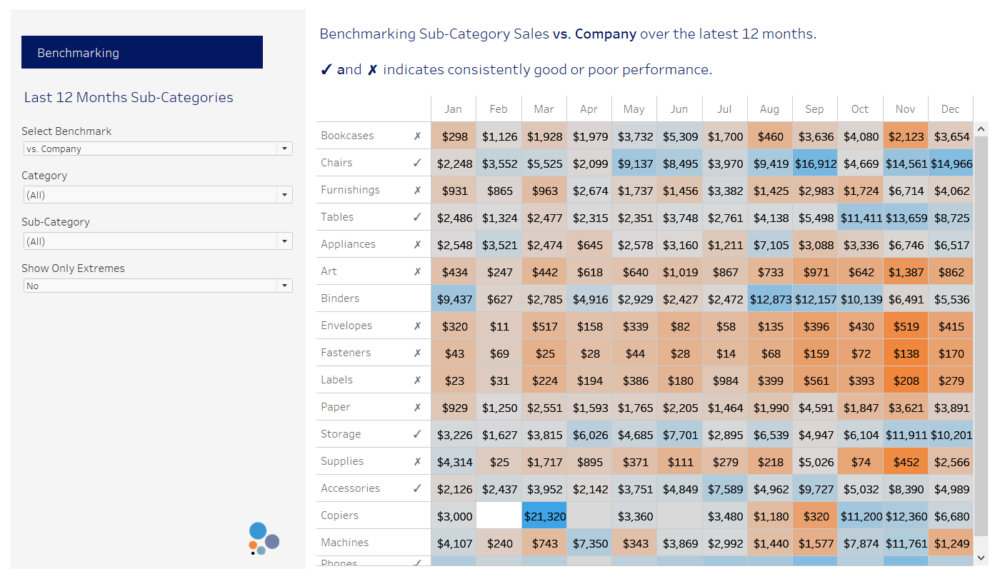
The visual below highlights the 'end game' for this task.
The primary visual, details, for each sub-category, their performance over the latest 12 months.
The colour indicates the difference to the selected benchmark (as determined using the control panel on the left side).
Besides each table, there is an indicator (✓ and ✗), which signifies consistently good, or consistently bad performance over this 12 month period.
And the control panel allows my Category and Sub-Category managers to view only their product sets, without affecting the benchmarking results.
Visual Build
Before we perform our benchmark calculations, let's get our visualisation set-up.
I want to put the Month of my date field [Order Date], onto columns, and I want to put my sub-categories on rows.
Now, I only want to see the sales values for the latest 12 months, not the values for each month, over all time; rather than filtering to the latest year, I'll write a calculation to do this (i'll actually write a few).
1. [Date Aggregation] - DATETRUNC('month',[Order Date])
//This calculation returns all of my dates truncated to a month level, for example, the date 2019-01-21 becomes 2019-01-01
2. [Latest Date] - { FIXED : MAX([Date Aggregation])}
//This calculation returns the latest month/year period in my dataset
3. [Last 12 Months] - DATEDIFF('month',[Latest Date],[Date Aggregation]) >= -11
//This calculation returns a boolean flag for each row, determining if it is in the latest 12 months (in which case TRUE), or not (in which case FALSE)
4. [Sub-Category Sales] - SUM(IF [Last 12 Months] THEN [Sales] END)
//This calculation returns the sales values for the latest 12 months only
I can take my 4th calculation and bring this into the view on the text shelf.
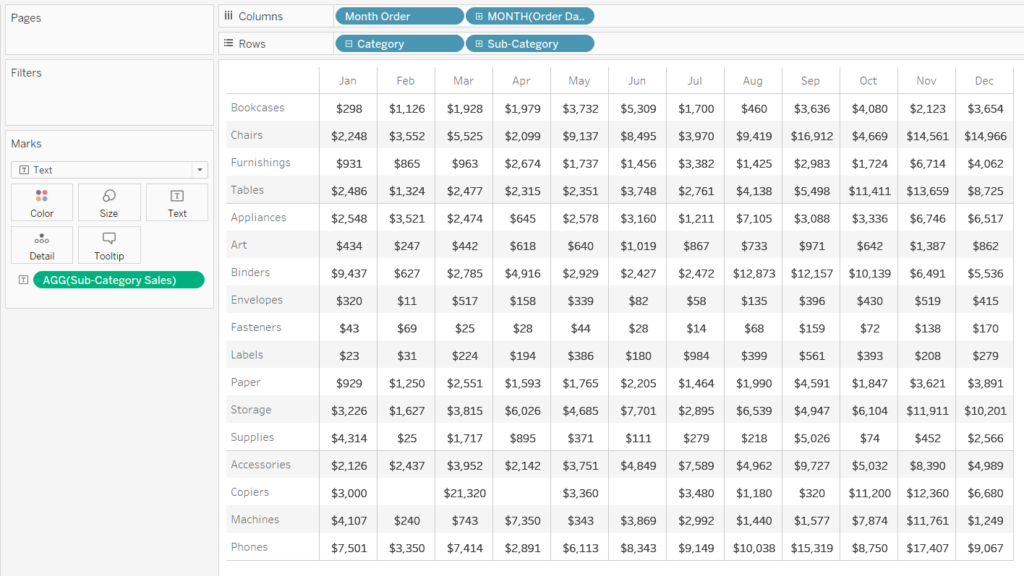
You'll see I have added a field titled 'Month Order' into the view; in this case it has no affect, because December is my latest month, but say November was my latest month, then I'd want December to be on the left side, rather than the right side, this calculated field, and it's subsequent placement on the columns shelf allows me to achieve this behaviour.
5. [Month Order] - MONTH([Date Aggregation])-MONTH([Latest Date])
//Return the difference, in months only, between the latest date and the date given on each row.
LODing
Now we've created our view, let's get 'knee deep in LODs', as we create our benchmark calculations.
Lets remember, for this example, I want to benchmark against;
a. The Company as a whole (i.e. the sales for this sub-category, vs. the average sales for all sub-categories).
b. The Category (i.e. the sales for this sub-category, vs. the average sales for the other sub-categories in my parent category)
c. YoY (i.e. the sales for this sub-category, vs. the sales for this sub-category, last year).
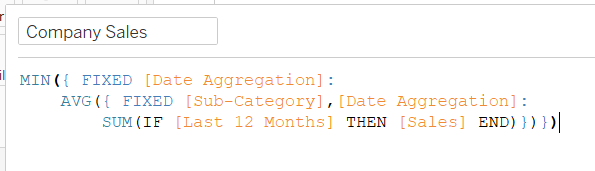
6. [Company Sales] - MIN({ FIXED [Date Aggregation]:AVG({ FIXED [Sub-Category],[Date Aggregation]:SUM(IF [Last 12 Months] THEN [Sales] END)})})
//This calculation requires a nested LOD. First, we create a fixed statement to return the Sum sales, over the last 12 months, for each sub-category and month. From this (fictional) table, we then perform a secondary fixed calculation, which returns the the average of these values, at purely the month level.
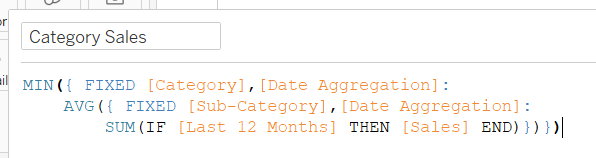
7. [Category Sales] - MIN({ FIXED [Category],[Date Aggregation]:AVG({ FIXED [Sub-Category],[Date Aggregation]:SUM(IF [Last 12 Months] THEN [Sales] END)})})
//This calculation again requires a nested LOD. First, we create a fixed statement to return the sum sales, over the last 12 months, for each sub-category and month. From this (fictional) table, we then perform a secondary fixed calculation, which returns the average of these values, at the month, and category level.
Now for the YoY benchmark, I have created two calculations.
8. [Previous 12 Months] - DATEDIFF('month',[Latest Date],[Date Aggregation]) >= -23 AND DATEDIFF('month',[Latest Date],[Date Aggregation]) < -11
//This calculation will return the value TRUE, if the difference between the latest date, and the given line is between -11 months and -23 months
9. [Previous Year Sub-Category Sales] - SUM(IF [Previous 12 Months] THEN [Sales] END)
//This calculation returns the sum of sales, providing the line date is within the Previous 12 Months time-frame.
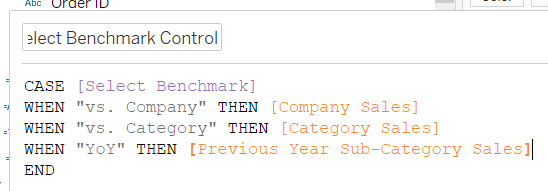
Parameter Control
As noted in the 'End Game' section; I would like my end-users to be able to control which benchmark they compare against, to do this I will create a list parameter containing three values, 'vs. Company', 'vs. Category' and 'YoY'.
I will then build a calculation which determines which has been selected by the user.
10. [Select Benchmark Control] - CASE [Select Benchmark] WHEN 'vs. Company' THEN [Company Sales] WHEN 'vs. Category' THEN [Category Sales] WHEN 'YoY' THEN [Previous Year Sub-Category Sales] END
//This calculation uses a case statement to reference the parameter in all scenarios and then return the desired field.
The next calculation will now create the difference between the selected benchmark value, and the actual sales value for that sub-category and month.
11. [Difference to Selected] - [Sub-Category Sales]-[Select Benchmark Control]
//Take the selected benchmark value away from the sub-category sales for the current 12 months. A positive value would indicate they are performing better than the benchmark; a negative value would indicate they are performing below the benchmark.
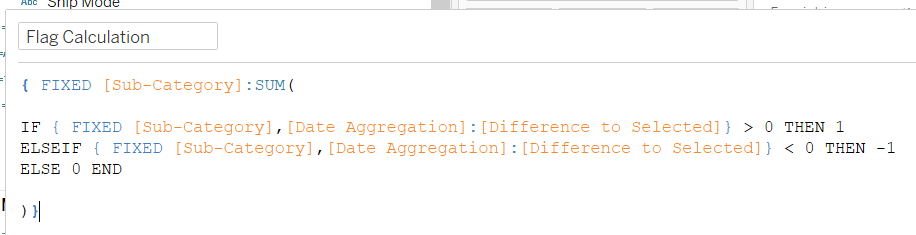
Visual Prompt
The table could be quite overwhelming to the audience; as a designer, I wanted my users to be able to quickly acknowledge those that have shown either consistently good, or consistently bad performance, which I will define as 9 or more of the 12 months being above or below the benchmark figure.
The calculation to achieve this is as follows...
12. [Flag Calculation] - { FIXED [Sub-Category]:SUM(IF { FIXED [Sub-Category],[Date Aggregation]:[Difference to Selected]} > 0 THEN 1 ELSEIF { FIXED [Sub-Category],[Date Aggregation]:[Difference to Selected]} < 0 THEN -1 ELSE 0 END)}
//For each sub-category, and month, if the difference to the selected benchmark is positive, then return the value 1, if the difference is negative, then return the value -1. Then, at a sub-category value, sum these figures.
13. [Flag Icon] - IF [Flag Calculation] >= 6 THEN '✓' ELSEIF [Flag Calculation] <= -6 THEN '✗' ELSE '' END
//Calculate if the sum value is greater than, or equal to 6, then return a positive flag, because this would indicate 9 or more months of positive performance, if the value is less than or equal to -6, then this would indicate 9 or more months of negative performance. Finally, if the value is between -6 and 6, then that would indicate indifferent performance, which in this case, we have decided would not be worth flagging.
Polishing Off
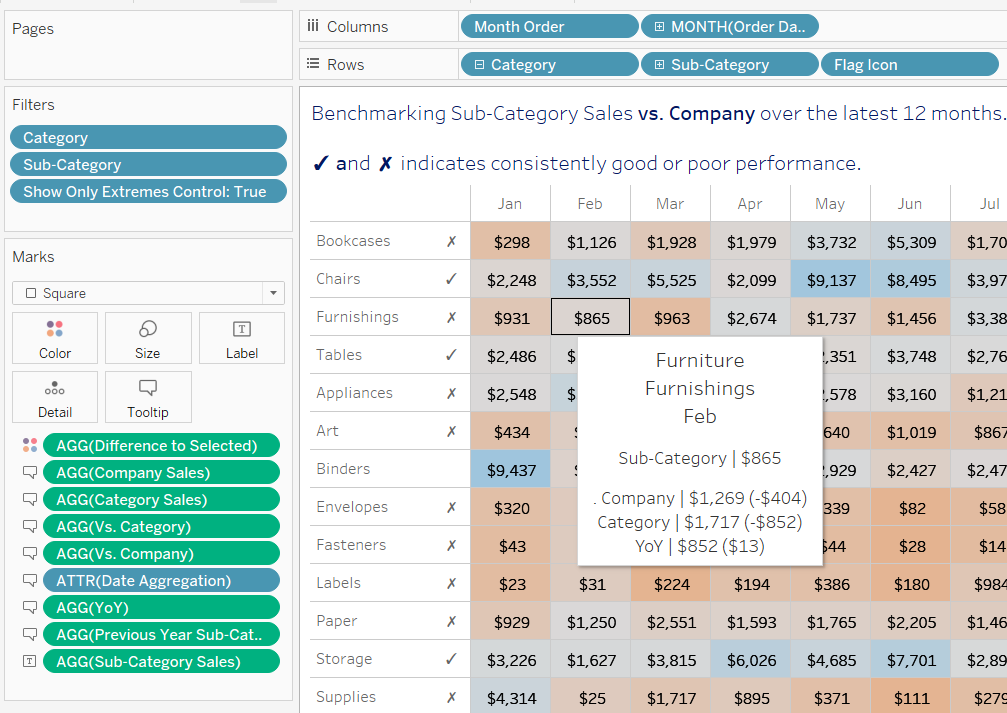
The image above highlights how I have bought the 'Flag Icon' field onto rows to make it visible to our end users.
I have also created a customised tooltip to give detail regarding the benchmarks the user hasn't selected.
Filters allow my users to present just the category or sub-category that is relevant to them, without affecting the benchmark scores (remembering we have used FIXED calculations, which are calculated before our filters according to the Tableau order of operations).
Finally I have created a dynamic title, which helps aid the users understanding in terms of what they are visually looking at, should they not understand the control panel on the left side of the view.
I hope this post is useful to some; it was certainly a fun project for myself!
Ben