

In my journey to demystify the Tableau JS API, I've previously covered how to embed a viz in a web object without the API, or how to make it autoload and refresh using the API, and even how to establish bidirectional communication between the webpage and the viz. In this post, I am going to keep digging on the JS API and some of the potential use cases. For instance, generating data-driven events. In this example, I will use some visuals and sound alerts --but this could be easily extended to other tasks/actions.
Scenario:
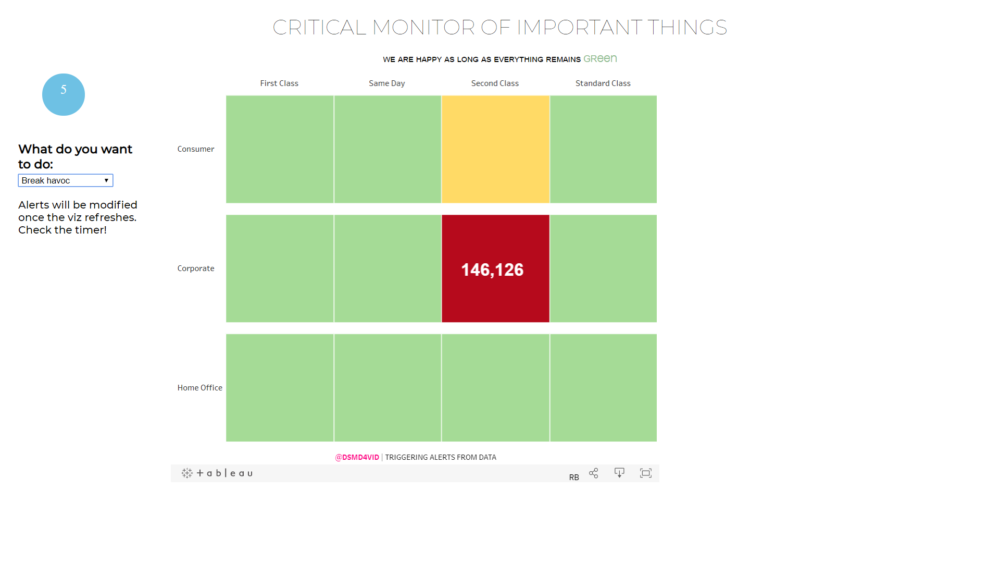
We are monitoring a critical dashboard that is showing 'very important data'. This dashboard refreshes every 10 seconds and is connected live to a database. The moment a critical value is detected, we need to take some action and fix it, alert someone about the incoming threat.
Go here to see the dashboard, interact with the dropdown on the left, wait for the counter to reach 0 and enjoy the alert. Bring the dropdown back to 'keep everything fine', wait for the counter to reach to 0 again, and fix that madness.
Alternatively, if you have access to TIL's Tableau Server, go here and interact with the buttons on the right. The principle is the same, the difference is that the Viz pointing to TIL's Tableau Server is actually connected live to a datasource, whereas the one in Tableau Public is using a filter to accomplish the same result.
Ok. Hopefully, you have now a good idea of the expected result. And, hopefully, you start to see possibilities as well. Right now, once the viz is refreshed, the webpage checks whether we need to do something (throw an alert) or not. This could be modified to sending an email, sending a purchase order, launching a nuclear counter-strike...
So, how?
Below, I have a detailed step-by-step, but let's stick to the high view for now:
We need...
- a Tableau viz, obvs.
- a webpage where we insert the viz and have the javascript running and
- the Javascript itself.
For the JS, we are going to need a few different functions: some Tableau-related that use Tableau's JS API (creating the viz, refreshing it, filtering, getting the data) and some non-Tableau related (in the example above: the alarm itself and the counter indicating time-left until next refresh).
Step-by-step:
HTML
You can donwload the full page from here, which I'll be breaking down below. The HTML is quite similar to the one we've seen before:
[iframe src='https://pastebin.com/embed_iframe/dCZLRwqq' style='border:none;width:100%;height:250px']This is the beginning of the page, where I set the title, load some fonts from Google and call the JS API.
The page itself consists of just a few elements: One header and a quick explanation, and then an element row that is split into two columns. One on the left, that will hold the circle with the countdown timer and the selector; and one on the right that will hold the viz.
[iframe src='https://pastebin.com/embed_iframe/sqXs8tpg' style='border:none;width:100%;height:600px']The selector is needed here because I'm simulating changes in the raw/live data with a filter (due to the limitations of using a viz hosted by Tableau Public). This is not needed in the example above, that uses a viz hosted in TIL's Tableau Server. Similarly, the row (identified as bckgTitle to be able to update it and change its format afterwards) and the columns, are just for aesthetics. The circle countdown, is also superfluous for the purpose of triggering the alarm, but I find it useful to see when the change should happen.
JAVASCRIPT
The JS is quite similar to the one used in the previous JS for dummies. First, we declare the variables:
[iframe src='https://pastebin.com/embed_iframe/wUR3BQJH' style='border:none;width:100%;height:350px']These are variables related to Tableau and the API (viz, workbook, activeSheet), related to the refresh action in the page (ourInterval, timeLeft, refreshInterval, downloadTimer), and audio elements to be played during the alerts or at resolution (audio & crisisAudio).
Then we have the Tableau related functions:
- One to embed the viz,
- One to refresh the view AND call the function that gets the data of the marks shown,
- One that reinitializes the interval and calls the refresh view,
- One to pass a filter to the viz.
The main function (below), gets the active sheet and the data from the marks in that sheet. Then, checks whether the mark meets a criteria (in this case, whether the status is 3 (that's my level to launch the alert). If any of the marks meets the criteria, then launches the alert. If not, either deactivates the alert (if it's active) or does nothing.
[iframe src='https://pastebin.com/embed_iframe/1vMMyrsf' style='border:none;width:100%;height:350px']Once we have the active sheet, we call the getSummaryDataAsync method, which, according to Tableau's documentation: 'Gets aggregated data for the fields used in the currently active sheet and returns it as an object'. Because it is downloading data the user must have permission to download data for the worksheet in Tableau Server.
To be precise, it returns a DataTable object (or, rather, the 'promise' of a DataTable, but I'm still unclear about the whole concept of 'promises'). And, inside the loop, we use one of the methods of the DataTable to obtain the actual data (in the line table.getData(). I know, because I have explored it before, which index of the row contains the value I'm interested in (row[2]). Had I not known it, I would have needed to a) either find it and fixed it, as I did previously, or b) assign it dynamically based on the name of the column (i.e. calling getColumns() and getting the name using getFieldName()).
The alert consists of launching the audio 'audio.play()', adding the string with the relevant info in the web object 'titleDiv' and adding the 'playing' class to the object 'backgTitle'. The 'playing' class is defined in the CSS below, basically, it changes the background color, adds a shadow and makes it pulse
[iframe src='https://pastebin.com/embed_iframe/4Qu4YsNg' style='border:none;width:100%;height:350px']The other functions maintain the countdown timer and get the text to update one of the web elements.
The only thing left is to add some CSS to position the elements and, importantly for the alarm bit, adding the effects in the 'playing' class.
[iframe src='https://pastebin.com/embed_iframe/bzRVVh9U' style='border:none;width:100%;height:300px']That did seem like a lot of code but... it only has a couple more functions than the one in the previous JS for dummies!
Thanks for making it to the end, and do let me know your thoughts.
The final outcome is here (using a filter to simulate changes in the data). You can find all the code used in GitHub.