

13 January 2014
Let's be honest. The Tableau Server viewer experience is pretty good, but for report interactors it takes a few clicks to get to the report you want them to see. You could, of course, send them URLs via email, but what if you wanted them to see a selection of views in workbooks right up? Well, let me tell you how.[caption id='attachment_2681' align='aligncenter' width='300']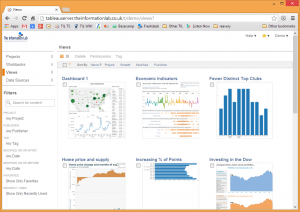 A typical user view of Tableau Server[/caption]
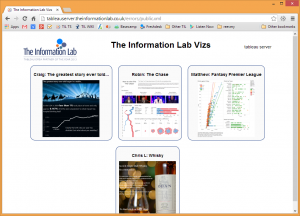 A controlled interface for getting direct access to your Tableau views[/caption]We started with a basic index page, of various views to go to. Following the links would take people to views in Tableau. There is a well-documented explanation of how to put additional web pages on your Tableau Server. But this didn't quite make it sexy enough. How do you make it obvious to people what to do when they go back?The best answer we came up with was to use a lightbox. You've seen these before, but normally with pictures. You click on one, the picture bursts out of the page, and you can flick through them without leaving the page. What we put together uses an open source version, but adapted to work with the Tableau Javascript API.[caption id='attachment_2677' align='aligncenter' width='300']
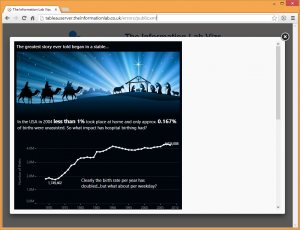 The view pops up within the web page when the user clicks on the thumbnail[/caption]You want to download it already? Go for it.Or just see it in action?
A typical user view of Tableau Server[/caption]Chrome Extension
Firstly, I must remind you about our Chrome Extension. You've already got this installed, haven't you? It's really great for getting to your views quickly, but it's not (yet) selective about which workbooks to show you.Lightbox
This idea came from one of our clients, who wanted to present some views to senior management, all from different workbooks in different projects, without having to see and follow the Tableau Server hierarchical interface. We looked at using tags, but this was in a board room with a giant touch screen TV. The experience had to be mind bending.[caption id='attachment_2683' align='aligncenter' width='300'] A controlled interface for getting direct access to your Tableau views[/caption]We started with a basic index page, of various views to go to. Following the links would take people to views in Tableau. There is a well-documented explanation of how to put additional web pages on your Tableau Server. But this didn't quite make it sexy enough. How do you make it obvious to people what to do when they go back?The best answer we came up with was to use a lightbox. You've seen these before, but normally with pictures. You click on one, the picture bursts out of the page, and you can flick through them without leaving the page. What we put together uses an open source version, but adapted to work with the Tableau Javascript API.[caption id='attachment_2677' align='aligncenter' width='300']The view pops up within the web page when the user clicks on the thumbnail[/caption]You want to download it already? Go for it.Or just see it in action?Putting together your XML
The starting point is an XML file. This contains some information about your server, in the demo case we have used Tableau Public; a logo file, and a title:\t<serverurl>http://public.tableausoftware.com</serverurl><logo>http://www.theinformationlab.co.uk/wp-content/uploads/2012/01/Info-Lab-Logo.png</logo><title>The Information Lab Vizs</title>There is also a series of nodes for each view. These <thumbnail> nodes relate to a thumbnail or link on the dashboard. The heading is the name for this thumbnail, the other three elements are the parts of the URL for the view. On Tableau Public, the full URL to Craig's post is:http://public.tableausoftware.com/views/JesusbornonaWeekday/JesusbornonaweekdayThis is split into three components: The server URL (public.tableausoftware.com), the path for the workbook (JesusbornonaWeekday) and the path for the view (Jesusbornonaweekday). If you use sites, you should include the /t/sitename in this Server URL.<heading>Craig: The greatest story ever told...</heading><serverurl>http://public.tableausoftware.com</serverurl><workbookpath>JesusbornonaWeekday</workbookpath><viewpath>Jesusbornonaweekday</viewpath></thumbnail>There is an optional fourth path, a <tooltippath>, which is will show the PNG version of a view (so is the same as ) as you hover over the thumbnail. Try hovering over my (Matthew's) viz.You can build this up using views from different servers but the user will need to be logged into each separately. The log-in link at the top is really there to determine where to get the javascript API from.