

8 December 2017
Here are 3 tips to rescue your dashboard next time you open up a workbook and all your charts have suddenly gone blank!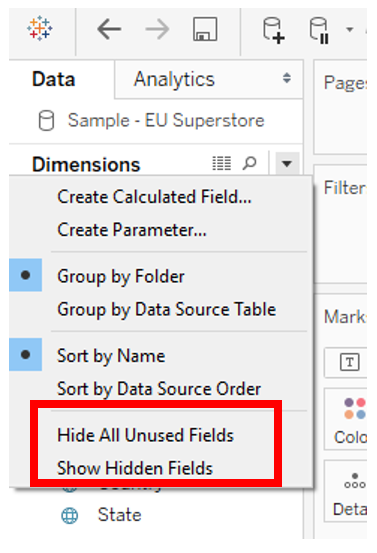 Hide those fields that aren’t being used in your dashboard. Then select ”Show Hidden Fields”, as this greys out those fields that are not used in any of your dashboards and may help you identify fields that are new in the data source or that you don’t need to be concerned about as they aren’t actually used in the workbook.
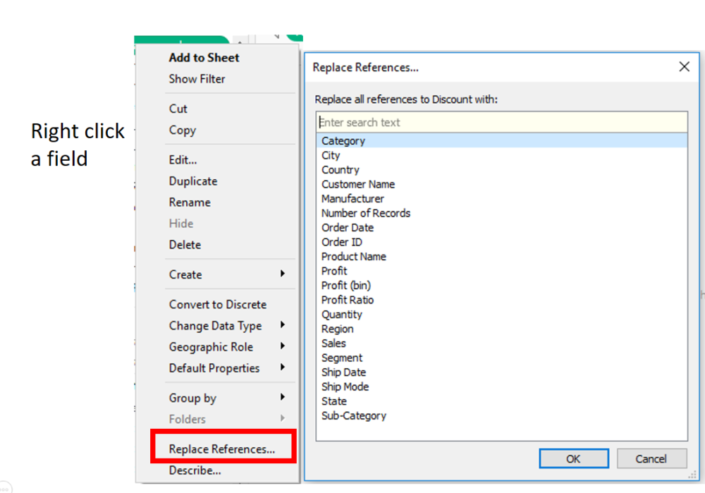 Have some of the names of your fields changed slightly? A change from CAPITALS to lower case, for example, could cause all the calculated fields that make use of that field to break. But you don’t have to go and edit each one of these calculations. You can use the replace references tool to automatically replace the original field with its new equivalent.Hopefully, your data changes aren’t too dramatic and you’ll be able to go from UH OH! to superhero in no time.
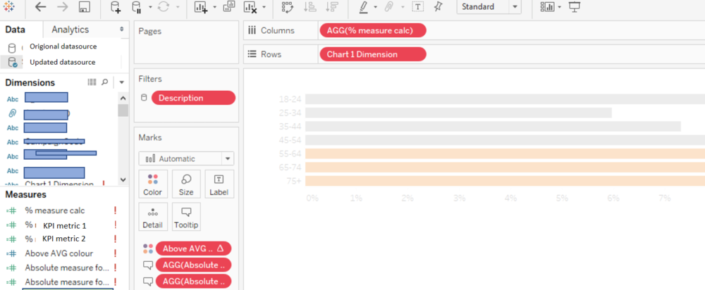
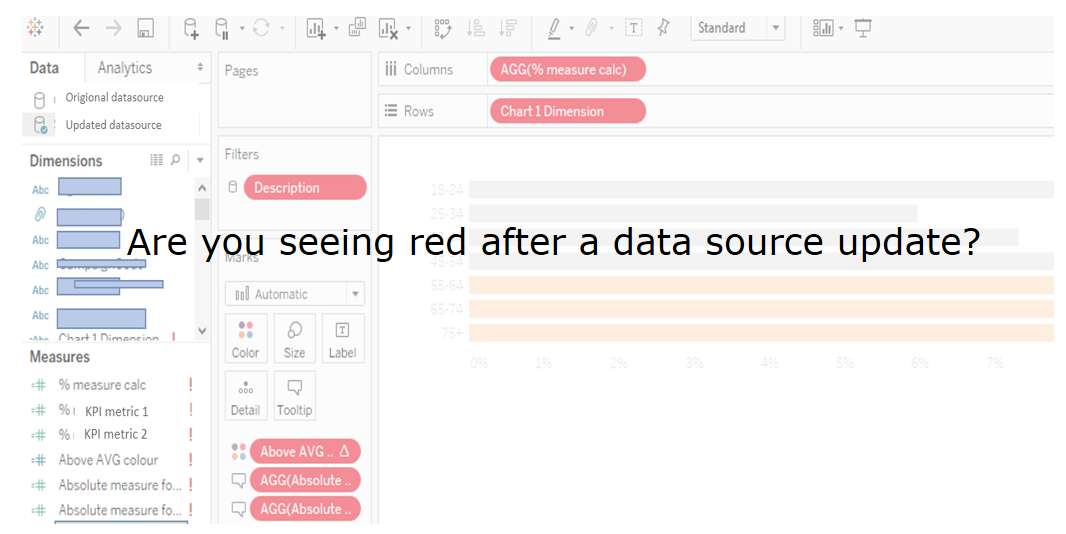
Why have my charts gone blank?
Has your underlying data changed? Maybe you’ve built a Proof of Concept on what you expect the data to look like and the real data doesn’t quite match up. Or IT has decided to alter the data setup without letting you know. These things happen when we are consulting with clients and it’s always good to be able to save the day.Tips to fix your data source errors:
1. Make use of the 'Hide All Unused Fields” option
Hide those fields that aren’t being used in your dashboard. Then select ”Show Hidden Fields”, as this greys out those fields that are not used in any of your dashboards and may help you identify fields that are new in the data source or that you don’t need to be concerned about as they aren’t actually used in the workbook.2. Once you've narrowed down your list of fields pay close attention to your data types.
I had created a group from one of the dimensions in my workbook and couldn’t figure out why Tableau kept telling me that the group was invalid. Groups can only be created from strings. Turns out this field had been changed to number in the data prep stage. Luckily Tableau makes it easy to change your data types by simply right-clicking the field.3. Replace references
Have some of the names of your fields changed slightly? A change from CAPITALS to lower case, for example, could cause all the calculated fields that make use of that field to break. But you don’t have to go and edit each one of these calculations. You can use the replace references tool to automatically replace the original field with its new equivalent.Hopefully, your data changes aren’t too dramatic and you’ll be able to go from UH OH! to superhero in no time.UH OH!
Yay! I fixed the dashboard