

4 August 2015
Market share figures have key importance in business as they put our performance in competitive context. In extreme cases, even if the sales volume or sales value of a company grows by 10% or 20%, if the average market growth is above this level the respective market share of the corporation declines. In this blog post we discuss the theory of market share calculations through the example of sales value share but this logic can be applied to various versions of 'shares'. Share of industry profit, share of applicants, share of votes, share of matches won - and the list goes on - are all analogous to our selected example. In fact, share (part-to-whole) calculations are everywhere in data. They are one of the three generic measure types:- absolute figures (e.g. Sales Value is 1 million EUR)- relative change (e.g. Year-on-Year Sales Value change is +3.4%)- share of a total (e.g. Sales Value of a business entity within a geographical territory and time period is 24%)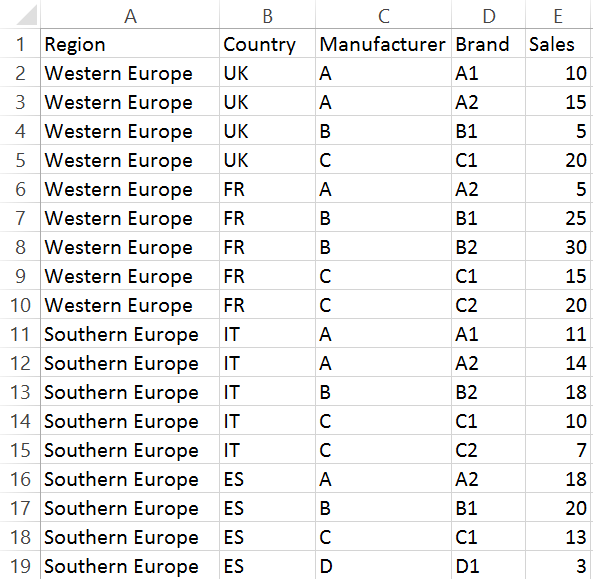 An interesting feature of market shares is that they can be calculated at various levels, meaning that the base, the 100%, the denominator may change depending on the business information required. Taking a look at share results of brands within a country certainly makes sense but so does analysing what share of a brand's sales in a specific country represents from a region's total sales. Moreover, what if our factory manager is curious of our brands' shares within our portfolio? This leads to dividing our brands' sales by our total corporate sales. This is another version of market share where 'market' is technically just a manufacturer.Tableau is about interrogating data and gaining answers practically as soon as the questions are asked. Switching between different 'levels' of market share (defined by the denominator) was not this fast as the denominator - being summary level data - is arriving from a secondary data source into the calculated field. Summary level data is blended to the nominator in the Tableau view. Blending is static in the sense that the dashboard user can not dynamically change the blend applied in the view. De-activating or activating linking fields happens in the data window in Tableau Desktop.Let's revert back to our data set and take a look at country level market shares:
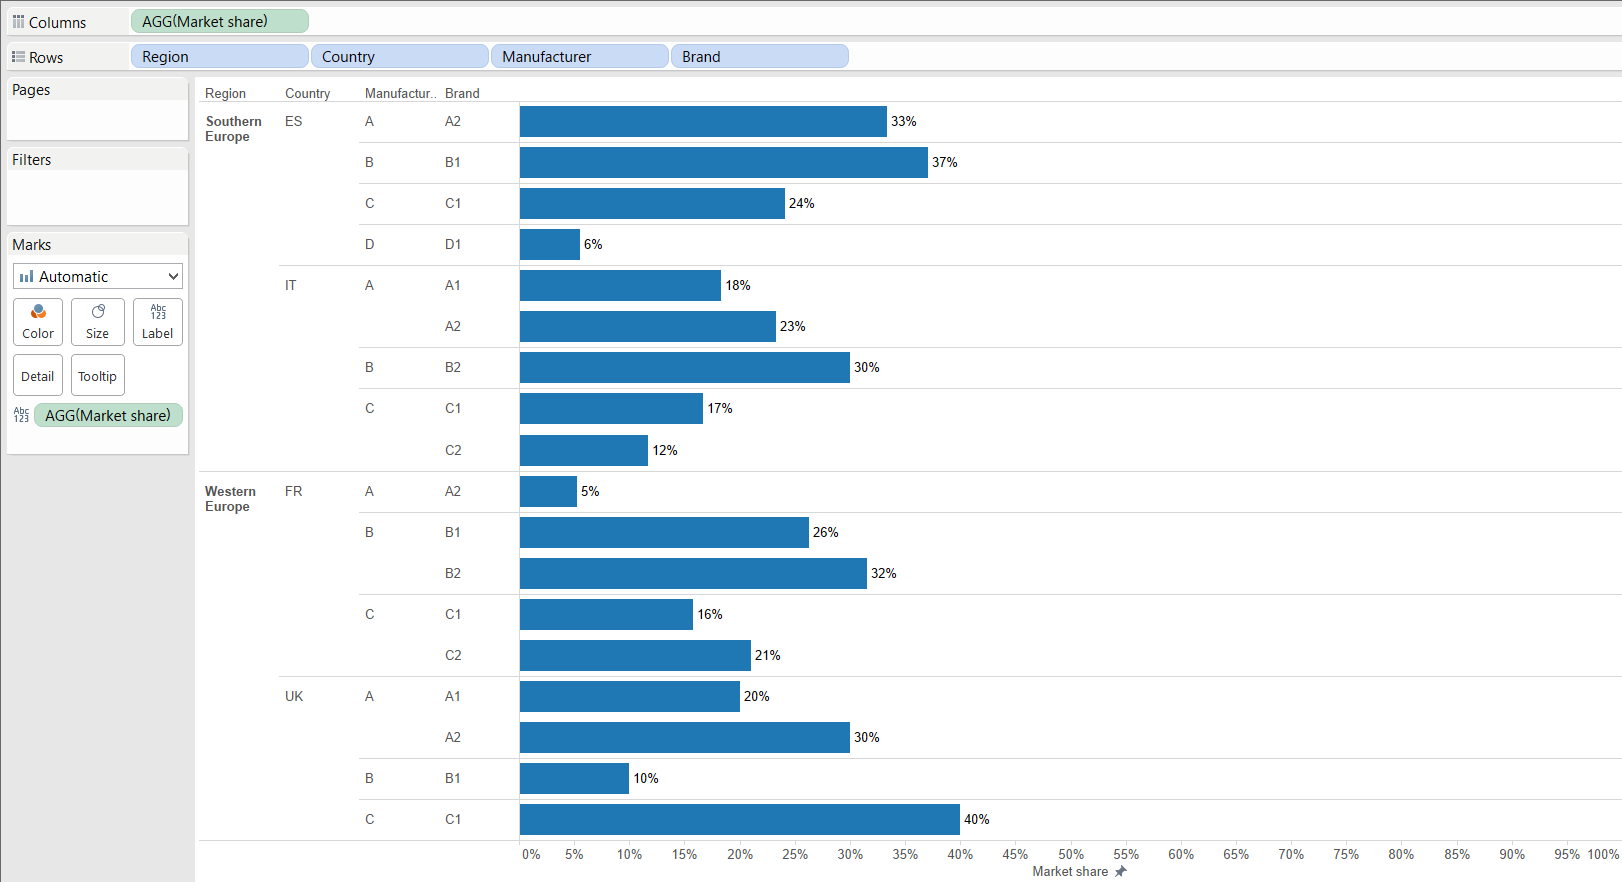 This view requires a blend on the Country field (as one country can belong to only one region, blending on the region is unnecessary).
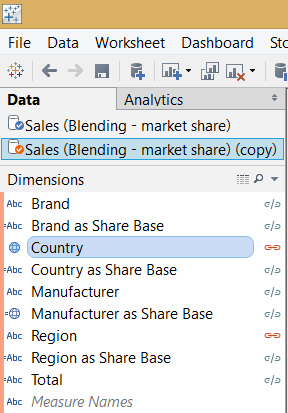 If we wanted to dive deeper and see shares of brands within the country level manufacturer portfolios, we should activate the Manufacturer field's link to be included in forming the level of detail of the secondary data source when the blend (the left join) to the primary is taking place. Data blending is a fantastic capability of Tableau and several great blog post have already been written about this concept.
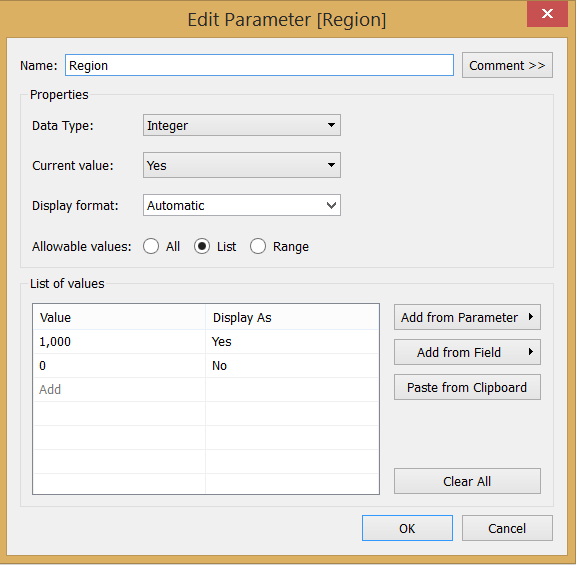 Calculating with numbers is much faster than string calculations, so the parameter's data type is integer, displayed as yes/no option for the users. Wait a minute, why is that a 1000 for yes and not just the classic 1/0? The 4 dimensions call for 4 parameters and I indicate the 'yes' options by 1000 for Region, 100 for Country, 10 for Manufacturer and 1 for Brand. Thus when I evaluate the combinations of user choices, it is clear that 1111 = 'I want all these dimensions in the share base' or 1010 = 'Shares calculated at Region+Manufacturer split'.Creating a parameter is just step one in the four steps towards having an interactive view. In step 2 we have to create a calculated field that is tied to the parameter value. In this example I called that 'Share Base Selection' where I am returning the unique value for every possible combination of the values of the four parameters.
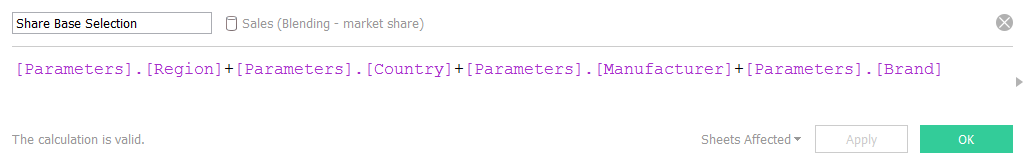 This field merely produces the values of 0 / 1 / 10 / 11 / etc., ending with 1111. How does this translate to actual dimension names or more precisely the scope of the share base? We have to turn to the FIXED LOD expression to solve this challenge. When the selection is zero, we do not want to split the total share base by any of the dimensions, so there everything is EXCLUDE-d.
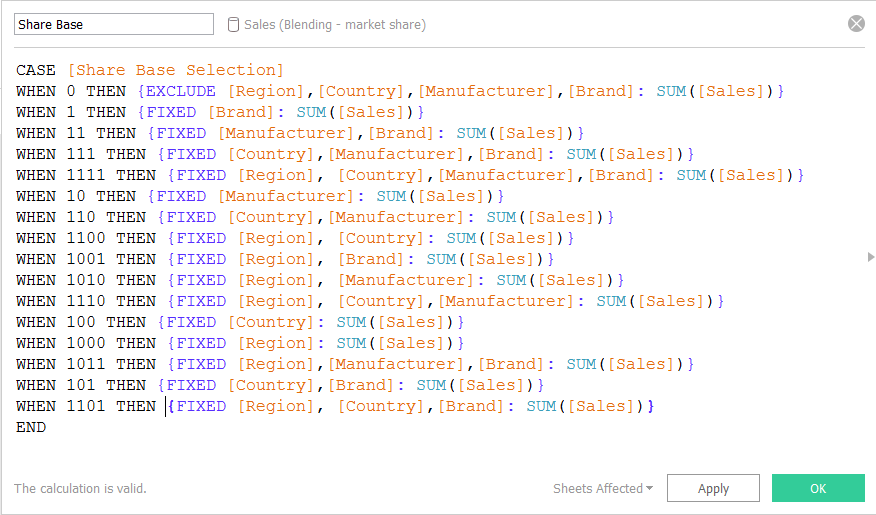 We are almost there, from here market share is just:
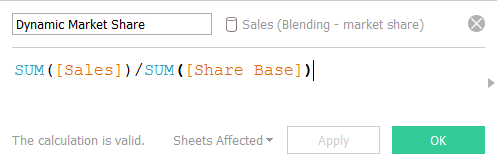 Once users can interact with the view via the Parameter Controls, we are ready.
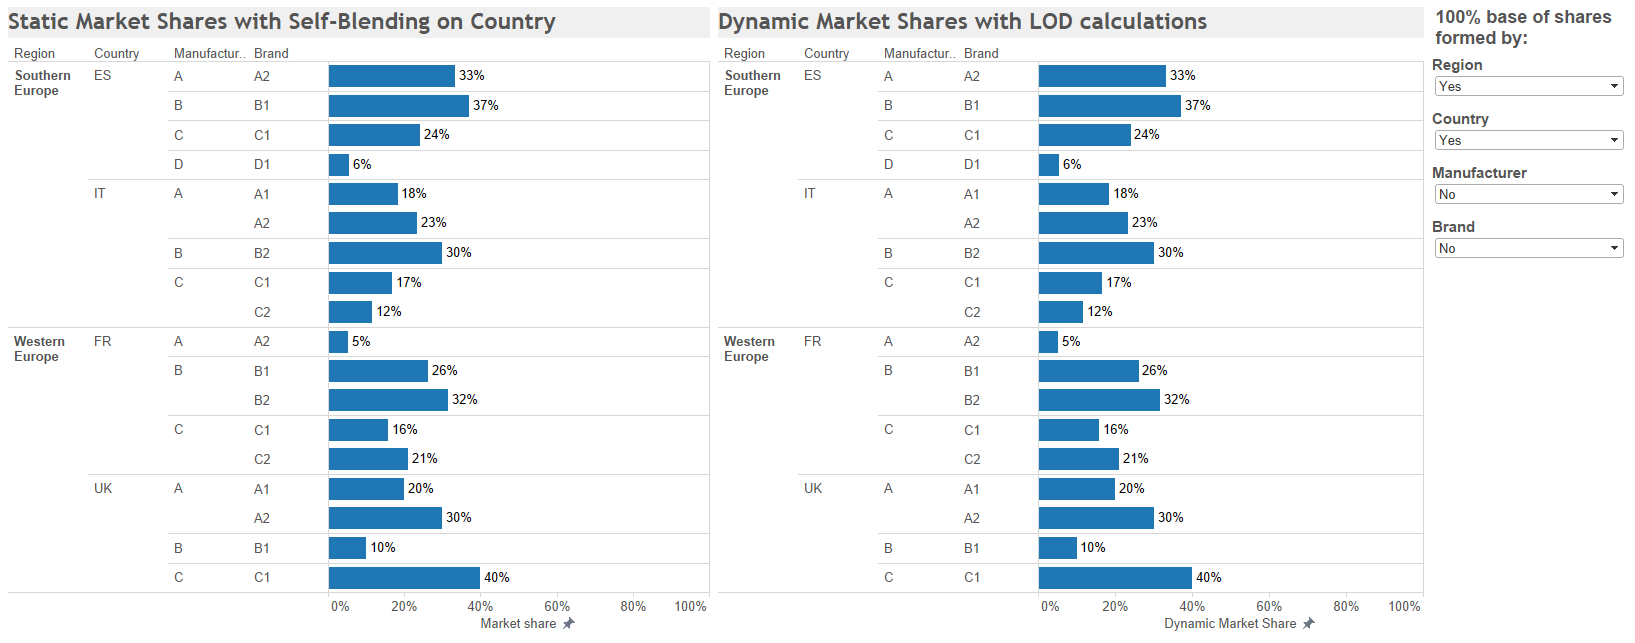 Is it really dynamic? Let's test it! Selecting Region and Manufacturer to form the share base (so we move up from Country level but check Brand+Country shares within the manufacturer regional total sales). The nominator is determined by the headers in the view, it is not dynamic now.
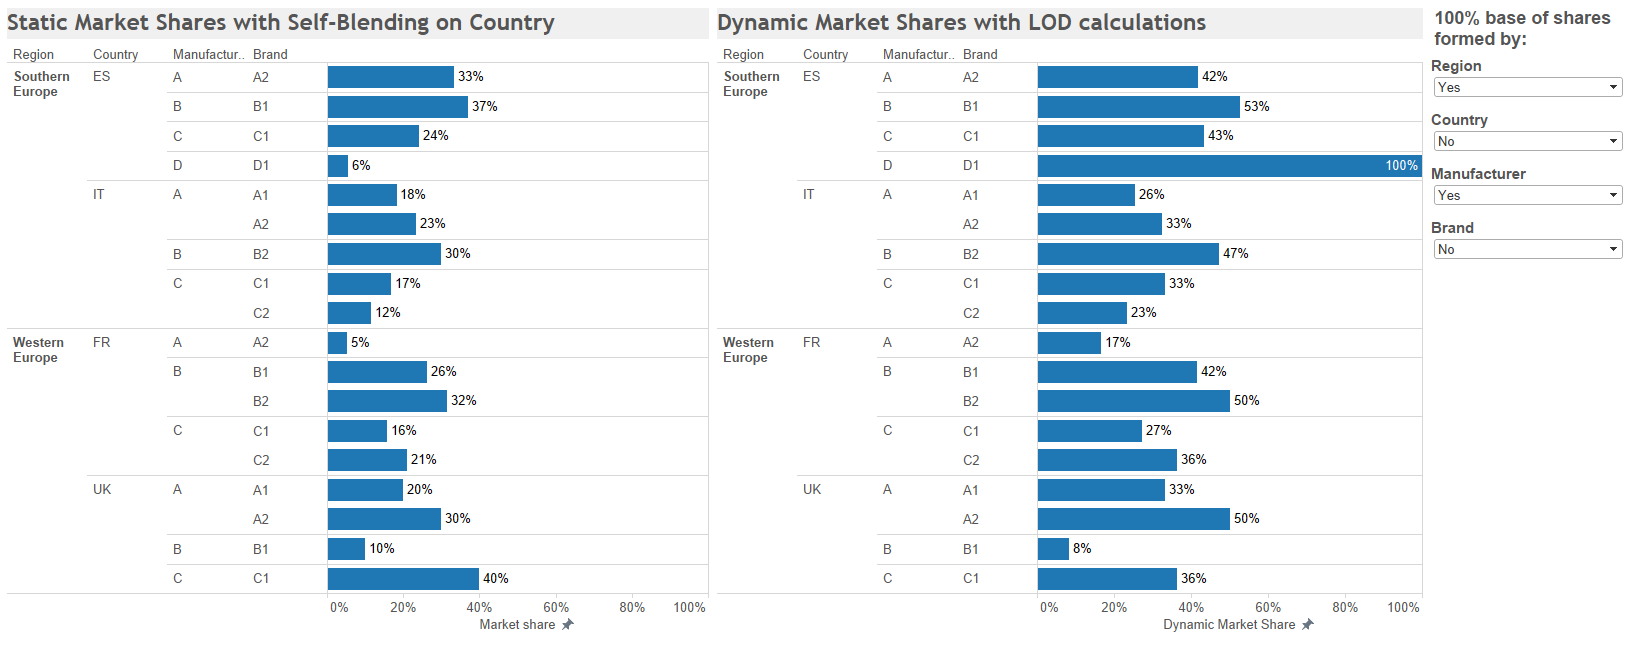 Yes, the correct results are rendered, in line with the varying base on which we look at the shares.Dynamic share calculation is excellently demonstrating the flexibility with the LOD calculations of Tableau version 9.
Static market shares in Tableau before version 9
Tableau is a great tool for data discovery, data visualisation hence calculating market shares was never an issue with it. Every market share figure is the result of a division, a nominator divided by a denominator. The nominator holds the detailed data like the sales value of a specific brand in a country in a given month. The denominator is the so called summary level data, for example the total market size in that country in that month (where market size is just the summary of all the sales value of all the brands in the market). An earlier blog post of The Information Lab outlines the traditional method of calculating market shares in Tableau. In a nutshell, the formula's denominator stems from a secondary data source, a duplicate of the original one. Data from the duplicate data source are blended to the primary data source.Let's see how this works! I tend to model concepts on small, simple datasets so the results in Tableau can be quickly validated. Our example covers Sales (value) data from several brands across countries that belong to two regions. The brands are owned by manufacturers.An interesting feature of market shares is that they can be calculated at various levels, meaning that the base, the 100%, the denominator may change depending on the business information required. Taking a look at share results of brands within a country certainly makes sense but so does analysing what share of a brand's sales in a specific country represents from a region's total sales. Moreover, what if our factory manager is curious of our brands' shares within our portfolio? This leads to dividing our brands' sales by our total corporate sales. This is another version of market share where 'market' is technically just a manufacturer.Tableau is about interrogating data and gaining answers practically as soon as the questions are asked. Switching between different 'levels' of market share (defined by the denominator) was not this fast as the denominator - being summary level data - is arriving from a secondary data source into the calculated field. Summary level data is blended to the nominator in the Tableau view. Blending is static in the sense that the dashboard user can not dynamically change the blend applied in the view. De-activating or activating linking fields happens in the data window in Tableau Desktop.Let's revert back to our data set and take a look at country level market shares:This view requires a blend on the Country field (as one country can belong to only one region, blending on the region is unnecessary).If we wanted to dive deeper and see shares of brands within the country level manufacturer portfolios, we should activate the Manufacturer field's link to be included in forming the level of detail of the secondary data source when the blend (the left join) to the primary is taking place. Data blending is a fantastic capability of Tableau and several great blog post have already been written about this concept.Tableau version 9, Level-of-detail calculations and market share
Now we know a lot about (market) shares and the technical aspects of their calculation in Tableau. Do we stop here? Of course, not. With Tableau version 9 the amazing level-of-detail (LOD) calculations have arrived, opening a route towards dynamically changing market shares. Understanding the concept of level-of-detail and how this leads to LOD calculations is itself worth several blog posts. I recommend reading the articles, blog posts from Bethany Lyons from Tableau.The link to market shares is straightforward as when changing the denominator (the 100% base), we are switching to different levels of detail. What if we analyse what percentage the brands' sales by country represent within the total region? The denominator is the regional total sales. If we decided to compare brand shares within a country, we move down to country level and so on.Revisiting our example
With the dimensions of Region, Country, Manufacturer and Brand, there are altogether 2x2x2x2 = 16 permutations of levels-of-detail at which market share can be calculated. Though in reality this is less than 16 due to the deterministic relationship between Region - Country and Manufacturer - Brand. So for instance when Brand is included into forming the share base, it does not matter whether we also include Manufacturer information as a Brand is owned by only one Manufacturer. The multiplication by 2 results from either including or excluding a dimension from the final share base. The word 'dynamic' before 'market shares' implies that we will be collecting input from the users, this is done via parameters. We ask the user whether they want to include each of these dimensions in the detail of the share base.For Region:Calculating with numbers is much faster than string calculations, so the parameter's data type is integer, displayed as yes/no option for the users. Wait a minute, why is that a 1000 for yes and not just the classic 1/0? The 4 dimensions call for 4 parameters and I indicate the 'yes' options by 1000 for Region, 100 for Country, 10 for Manufacturer and 1 for Brand. Thus when I evaluate the combinations of user choices, it is clear that 1111 = 'I want all these dimensions in the share base' or 1010 = 'Shares calculated at Region+Manufacturer split'.Creating a parameter is just step one in the four steps towards having an interactive view. In step 2 we have to create a calculated field that is tied to the parameter value. In this example I called that 'Share Base Selection' where I am returning the unique value for every possible combination of the values of the four parameters.This field merely produces the values of 0 / 1 / 10 / 11 / etc., ending with 1111. How does this translate to actual dimension names or more precisely the scope of the share base? We have to turn to the FIXED LOD expression to solve this challenge. When the selection is zero, we do not want to split the total share base by any of the dimensions, so there everything is EXCLUDE-d.We are almost there, from here market share is just:Once users can interact with the view via the Parameter Controls, we are ready.Is it really dynamic? Let's test it! Selecting Region and Manufacturer to form the share base (so we move up from Country level but check Brand+Country shares within the manufacturer regional total sales). The nominator is determined by the headers in the view, it is not dynamic now.Yes, the correct results are rendered, in line with the varying base on which we look at the shares.Dynamic share calculation is excellently demonstrating the flexibility with the LOD calculations of Tableau version 9.