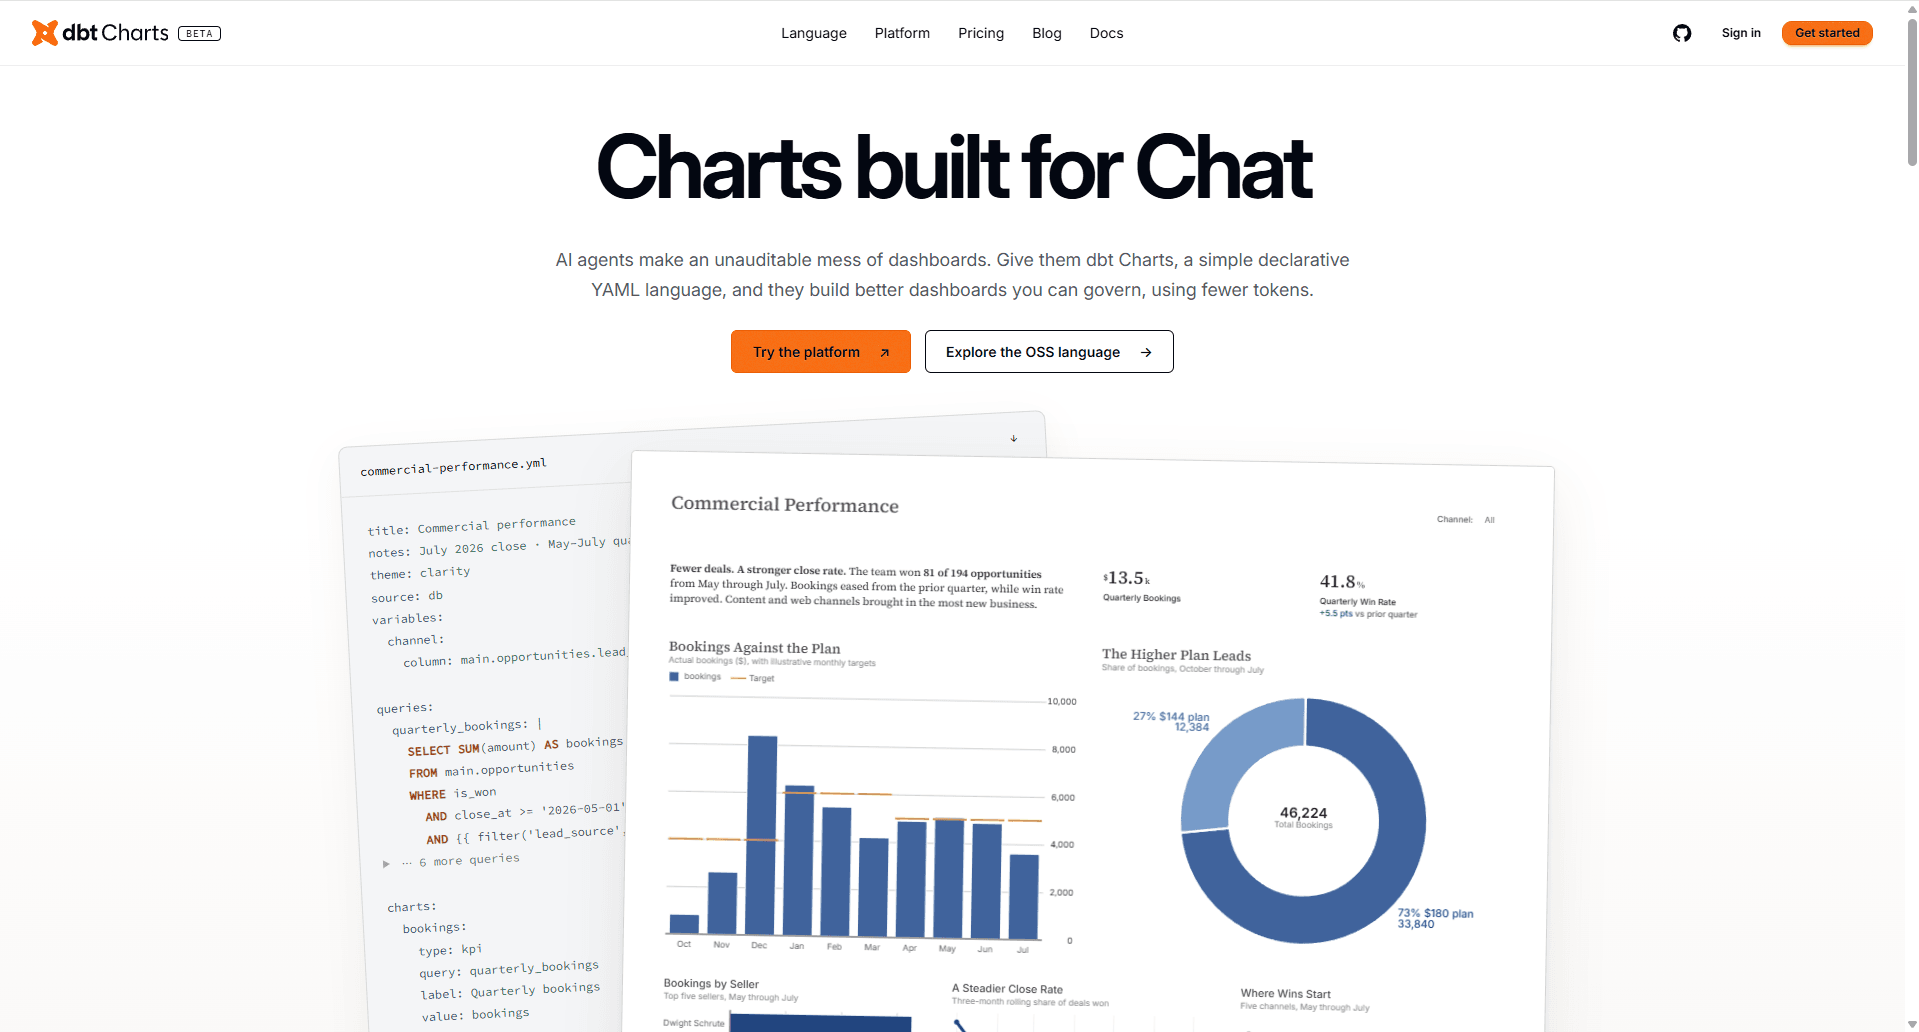
dbt Charts was announced as a Public Beta at dbt Summit 2026. The idea is dashboards as code, with the dashboard itself being defined in YAML. This has many different benefits, including, but not limited to:
Dashboards can be version controlled. Version control keeps a record of changes to the dashboard. It makes rolling back to a previous version a piece of cake. It also makes collaboratively working on a dashboard much simpler. No more sharing a dashboard file back and forth between developers
AI Agents will be able to read and write dashboards. Agents can work with YAML no problem, whereas a chart built through a User Interface is optimised for humans, rather than Agents
Ease of updating multiple dashboards quickly. Say you've received a request to “just add a filter” to dozens of dashboards. The logic can be written once and easily copied over to the other dashboards, rather than replicating the change across each individual dashboard
The best news is that it's really easy to start playing around! Head to play.dbtcharts.com to enter the dbt Charts Playground. Here you'll find lots of example dashboards that you can immediately peak under the hood at. I recommend starting with the Simple Example. Let's take a look at the YAML:
title: "Simple Example"
notes: "Minimal example showing SQL data source usage"
source: examples_db

queries:
  revenue_by_date: |
    SELECT
      date,
      SUM(revenue) AS revenue
    FROM ecommerce_orders
    GROUP BY date
    ORDER BY date

charts:
  revenue_trend:
    query: revenue_by_date
    type: line
    x: date
    y: revenue

rows:
  - cols:
      - revenue_trend
Let's take a look at the different sections:
Top section - Specify the title that should appear at the top of the dashboard, along with a description. The source will be referring to a source defined in the dbt_charts.yml file. This file will contain the connection details to the data source
Queries - To build a chart, you need to define the SQL query that will get the right granularity of data for that chart and all the necessary fields to include. The more charts on the dashboard, the more queries you'll need to define. Currently, this is disconnected from the semantic layer, which feels like a miss and a chance for a lot of chaos to develop within these YAML files. However, it's very early days, so we'll see how it develops
Charts - There are currently 16 chart types available:
Bar
Histogram
Spark Bar (An inline mini bar chart)
Line
Area
Scatter
Pie
Donut
Table
Heatmap
KPI
Callout (An annotated value card)
Map
Point Map
Bubble Map
Geoshape
These chart types can be customised through colour, size and shape, similar to the Tableau marks card. The style key in the YAML will then allow further customisation, such as controlling grid lines, labels and whether to stack marks. There are also 6 other chart types that can build upon an above chart type through layers, overlays and styling. These are called composed charts:
Lollipop
Bullet
Slope
Bump
Dot plot
Steamgraph (An area with a shared centered baseline)
Listening to dbt Chartographer RJ Andrews speak at dbt Summit, these chart types have been chosen to enable the majority of data viz best practice. Some unconventional choices have been made, such as the axis defaulting to the right hand side, since the most recent data point is often the most important and therefore should be closest to the axis.
Another thing to note is that although you have an x and y key, this doesn't strictly refer to the x and y axes. For example, with the bar chart type, the x should always refer to a dimension and the y should always refer to a measure. To control the orientation of the bars, there is an option within the style key.
Bottom section - This is how you control the layout of the dashboard. You can have all charts in a single column or row, or specify a grid format. It's also possible to create tabs for multiple dashboards, if you feel the view is getting too cluttered, as well as create collapsible sections.
From my exploration, the ecommerce_orders table from the Simple Example lives in DuckDB and has the following columns:
date
category
product
region
units_sold
revenue
I'm someone who likes to learn by doing. If you're the same then you have all you need to start playing around. Although a link to the docs would probably be useful too!
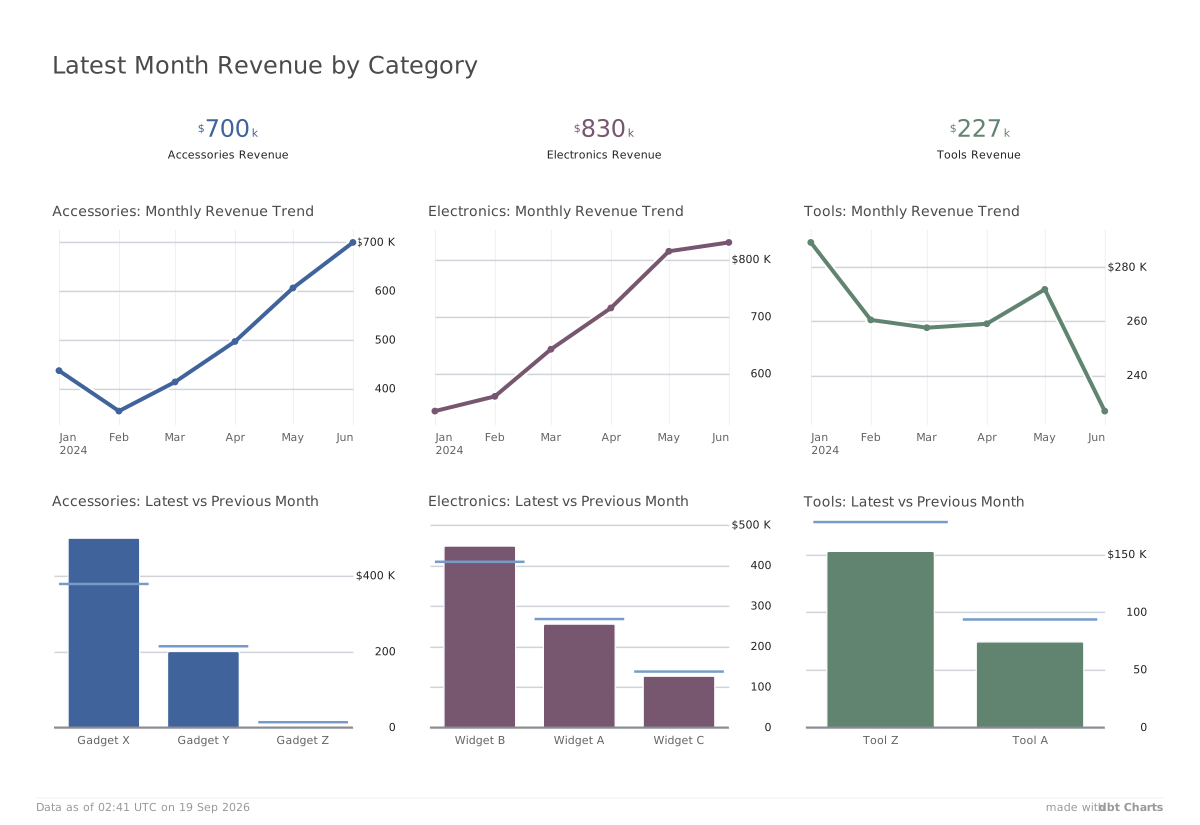
Since I was short of time, I decided to take advantage of the AI in the bottom left corner and vibe code a dashboard. Then I could tweak it to how I wanted it styled. This took a lot of back and forth to the documentation to see what was possible. The AI also had a tendency to want to entirely rewrite the YAML and delete charts I was previously happy with. So I recommend taking a copy of the URL before asking the AI to make any tweaks! The URL changes as you make changes to the YAML, which is handy for you to be able to return to what you've built in the playground at a later date.
I'm unconvinced that what the AI helped me produce is best practice, since I did discover midway through that small multiples were possible. What the AI generated for me was a separate query, filtering to each category individually, for each chart. This doesn't seem the most efficient. I asked the AI why it didn't use small multiples and it confessed it that should have.
The YAML file has ended up getting pretty long from my afternoon of playing around. I don't find it the easiest to navigate, but perhaps some of that could be improved through better spacing. Thank goodness for CTRL+F!
You can see the results of my first dashboard in dbt Charts below and view the 260 line YAML file here. Another cool thing about this chart is that you can change the colour themes from the dropdown in the top right of the dashboard. Yes, there is a dark mode option for all those who hold that preference!