

19 April 2016
Parameters make a viz more interactive and can be used for a wide range of functions in Tableau. You can change the dimensions that are being shown in a viz as well as change the measures that are being aggregated in the viz. So why not use parameters in LoD calculations?In this example I want to create a histogram that shows the distribution of quantity of items sold. I want to know how many customers fall into each quantity bin. I then want to use a parameter so I can switch to find out how many products fall into each quantity bin.The parameter in this example is:Product/Customer Parameter; 1 display as Product, 2 display as Customer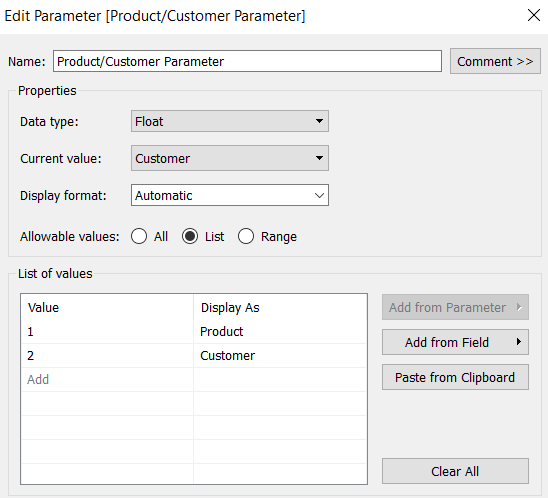 I then need to write a calculated field (called [Product/Customer Dimension]) so that I can switch between the two dimensions:CASE [Product/Customer Parameter]WHEN 1 THEN [Product Name]WHEN 2 THEN [Customer Name]ENDI now need to create a LoD calculation to create quantity bins. One advantage about using a LoD to create bins is that you don’t need to have uniform sized bins.To start my LoD (called [LoD Quantity Bins]) I need to specify what dimension the calculation will be aggregated at. Here’s where I use the calculated field I just created so that I can switch between the two dimension:{fixed [Product/Customer Dimension]:Next I need to type out the different bins. The important thing to note here is that the calculation part of the LoD has to be an aggregation. Therefore the [Quantity] measure that is going to be binned needs to be aggregated:(if sum([Quantity]) >=0 and sum([Quantity]) <=9 then '0-9'elseif sum([Quantity]) >=10 and sum([Quantity]) <=24 then '10-24'elseif sum([Quantity]) >=25 and sum([Quantity]) <=49 then '25-49'elseif sum([Quantity]) >=50 and sum([Quantity]) <=99 then '50-99'elseif sum([Quantity]) >=100 and sum([Quantity]) <=149 then '100-149'elseif sum([Quantity]) >=150 then '150+'END)}What you’ll notice is that the created calculation is a dimension. This allows you to use the calculation categorically. If you drag the [LoD Quantity Bins] dimension onto the columns shelf then right click and drag the [LoD Quantity Bins]. You should now see something similar to this:
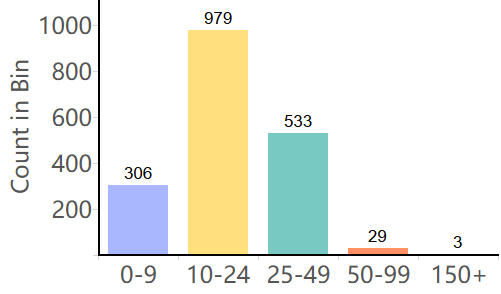 If you add the parameter to the sheet by clicking on the parameter and selecting “show parameter control” you will then be able to select ‘Customer’ and you should now see something similar to this:
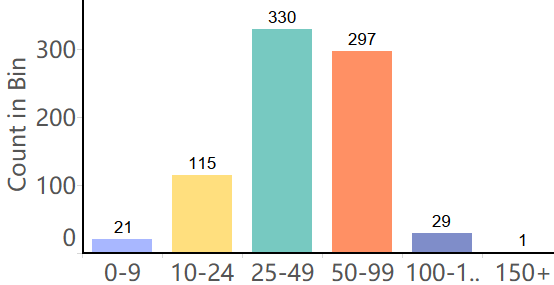 And there you have it a parametrised LoD Histogram. Check out the workbook on my Tableau Public to see how you can take this concept further to create new, interesting ways to visualise your data:Paramater in a LoD
I then need to write a calculated field (called [Product/Customer Dimension]) so that I can switch between the two dimensions:CASE [Product/Customer Parameter]WHEN 1 THEN [Product Name]WHEN 2 THEN [Customer Name]ENDI now need to create a LoD calculation to create quantity bins. One advantage about using a LoD to create bins is that you don’t need to have uniform sized bins.To start my LoD (called [LoD Quantity Bins]) I need to specify what dimension the calculation will be aggregated at. Here’s where I use the calculated field I just created so that I can switch between the two dimension:{fixed [Product/Customer Dimension]:Next I need to type out the different bins. The important thing to note here is that the calculation part of the LoD has to be an aggregation. Therefore the [Quantity] measure that is going to be binned needs to be aggregated:(if sum([Quantity]) >=0 and sum([Quantity]) <=9 then '0-9'elseif sum([Quantity]) >=10 and sum([Quantity]) <=24 then '10-24'elseif sum([Quantity]) >=25 and sum([Quantity]) <=49 then '25-49'elseif sum([Quantity]) >=50 and sum([Quantity]) <=99 then '50-99'elseif sum([Quantity]) >=100 and sum([Quantity]) <=149 then '100-149'elseif sum([Quantity]) >=150 then '150+'END)}What you’ll notice is that the created calculation is a dimension. This allows you to use the calculation categorically. If you drag the [LoD Quantity Bins] dimension onto the columns shelf then right click and drag the [LoD Quantity Bins]. You should now see something similar to this:If you add the parameter to the sheet by clicking on the parameter and selecting “show parameter control” you will then be able to select ‘Customer’ and you should now see something similar to this:And there you have it a parametrised LoD Histogram. Check out the workbook on my Tableau Public to see how you can take this concept further to create new, interesting ways to visualise your data:Paramater in a LoD