20 October 2014
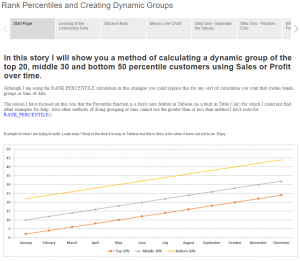
In this story I will show you a method of calculating a dynamic group of the top 20, middle 30 and bottom 50 percentile customers using Sales or Profit over time in just six steps.
Although I am using the RANK PERCENTILE calculation in this example you could replace this for any sort of calculation you want that creates bands, groups or bins of data.
The reason I have focused on this was that the Percentile function is a fairly new feature in Tableau (as a built in Table Calc) for which I could not find other examples for help. Also other methods of doing grouping or bins cannot use the greater than or less than method I have used for RANK_PERCENTILE()
Click on the image below to be taken to the workbook on Tableau Public.

