

22 March 2018

One of the parts I love about my role at The Information Lab is I get to work with lots of fantastic problems from customers; yesterday was no different. I was approached by one of our customers (Adam Green) via one of our support channels with a very interesting challenge. In this blog post I'm going to walk through the steps that Adam and I took to solve the problem, some of the dead-ends we hit and the final solution.I hope there's value in showing the overall approach to problem solving, because the path to solutions isn't always as straightforward as sometimes detailed in blog posts. Neither is the 'all knowing Zen' an image I wish to portray - solutions to problems take place through an application of logical steps, via which one eventually arrives at a final solution. Those steps are part of the solution and key to understanding how to tackle problems, missing them out in pursuit of a 'clean' solution misses the key learning of how to approach and tackle similar problems.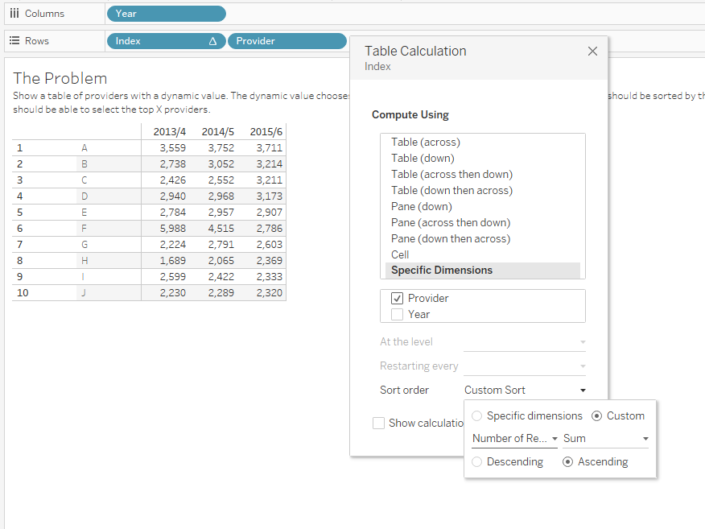 Adam's solution wasn't working because his sorting didn't respond to his dynamic measure.
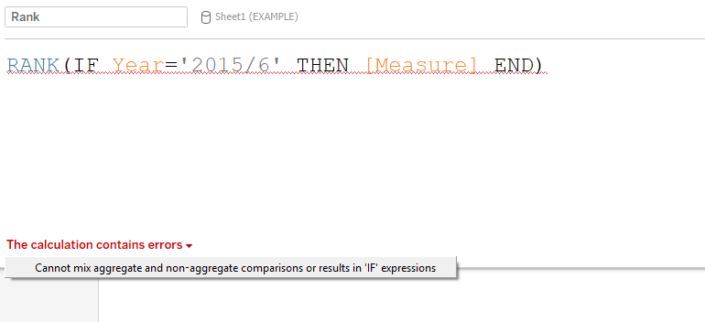 Anyone who has spent any time with Tableau will be familiar with this error and so let's explain what is happening and how we can solve it.[Measure] is actually a calculated field consisting of a parameter (to enable the dynamic selection) and three different measures, all of which are aggregations. i.e. they work on the data in some way to sum it, or look at change over time.
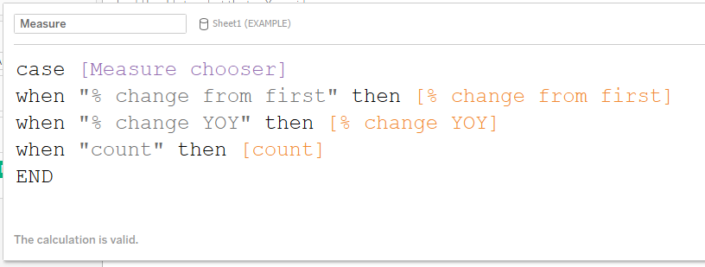 Whenever we have aggregations in Tableau, e.g. sum([Number of Records]) then Tableau uses what we call the Level of Detail inside the view to decide how to calculate them. The level of detail in the view is determined by the Dimensions we've used in the view, on either Rows, Columns or the Marks pane.
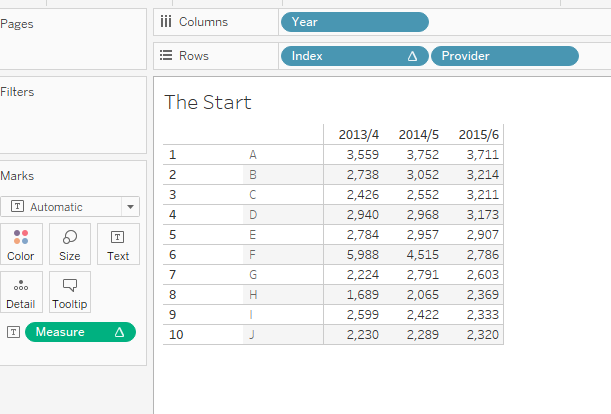 In this view we need to find the Dimensions in order to work out the level of detail. It's important not to confuse these Dimensions with the blue 'Discrete' fields. Dimensions in Tableau can be Continuous (Green) or Discrete (Blue). The way to spot a Dimension is to look for the lack of the sum() or other aggregation including ATTR(), an AGG(), or a Δ symbol (all of which signify measures). Remember that you can change fields from Dimensions to Measures (and vice versa) in the view and so relying on whether a field is in the Dimension or Measures pane will not help all the time.Three examples of measures are shown below (signified by AGG, Δ and SUM respectively).
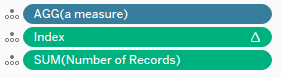 Anything else (blue or green) is a Dimension. In the Adam's view the dimensions are Year and Provider.Therefore we can say our data is at the Year and Provider level. Any other measures will be aggregated up to the Year and Provider level by Tableau in order to work out their values.What does that have to do with our error Cannot mix aggregate and non-aggregate comparisons or results in an IF expression?In this case we have our aggregate (the [Measure] field) and we're mixing it with our [Year] field. The [Year] field is a row level value (i.e. at the same level as our original data) and so is not aggregated. The [Measure] field is an aggregation and so needs to be calculated at the Level of Detail of the view. Tableau therefore rightly complains because it can't mix these two values - one is a row value, the other is dependent on aggregating the data up to Year and Dimension.One possible way to solve this problem would be to change the [Measure] aggregation to be at the row level. Doing this involves using what is called 'Level of Detail' (LOD) calculation in Tableau, FIXED. This calculation will perform the aggregation in question for you in a temporary table and then put join it back onto original data so that it exists at the row level. However FIXED calculations can only deal with simple aggregations like sum and average and so I immediately ruled these out as a possible solution.Therefore we need another solution, we need to change the [Year] field, which is at the row level into an aggregation. But how do we aggregate a Year value? The usual options of SUM and AVG are not possible here because Year isn't a value we want to sum or divide. So we need to use aggregations such as MIN or MAX.Remember that when we aggregate the Year we will move it up to the level of detail in the view, which in this case is [Year] and [Provider]. Therefore when we aggregate the Year then MAX(Year) will be the same as MIN(YEAR) . If that is difficult to understand then consider the table below, this shows the data at Year and Provider level. We are calculating the MIN(Year) in the middle of the table for each value at that level of detail. The table would look the same if we were calculating MAX(Year).
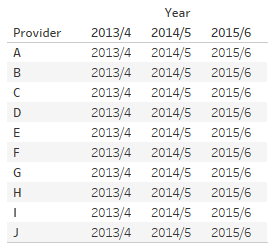 In Tableau we can also calculate the ATTR (attribute) of a value. This is a special value that simply says if the Max=Min then return the value otherwise return a * (a star).Therefore you will often see people adding a MAX or a MIN or (the clever ones) using a ATTR. When the value is at that Level of Detail they are all equivalent.So to going back to our error:We can solve this three ways, these are all equivalent:
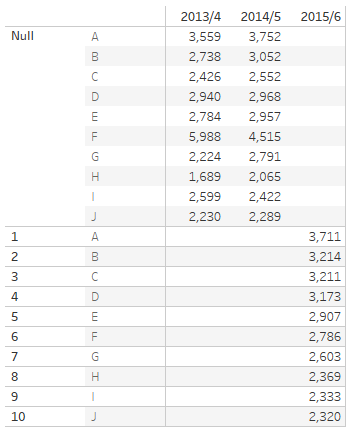
 The key to solving this problem I realised was to give every year the same value of [Measure] for each provider based on its 2015/16 value. That way when we rank that value we won't get a separate Rank per year. But how can we do that?In Tableau if we need a calculation that moves along a dimension in the current view then we turn to Table Calculations. Here we want to take move along the Year Dimension for each Provider. We want to start with the year 2015/16 and take the value of the measure, then we want to move to the next year and keep that value.We can use PREVIOUS_VALUE() to return the previous value, so I build the following calculation:
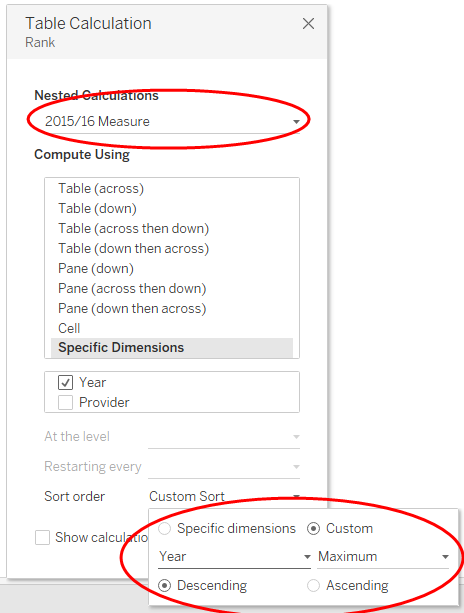 At the bottom we are ensuring we step through the years in the right order by using a custom sort. Remember that our Year Maximum and Minimum don't matter at this level of detail, and so the only important factor aside from them is the Descending to ensure we start with 2015/16. You can see below this does what we need because when we add it to the label it returns the same value for each year.
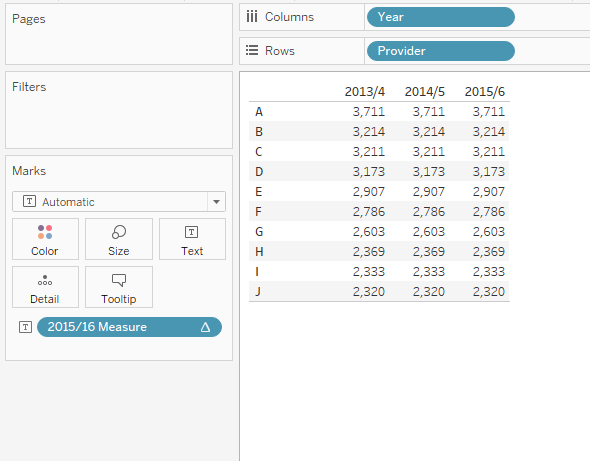 Once we've done that then we need to RANK([2015/16 Value]) along the Providers. Again we create the calculation and make sure we use the correct nested calculation, computing the ranking for Providers:
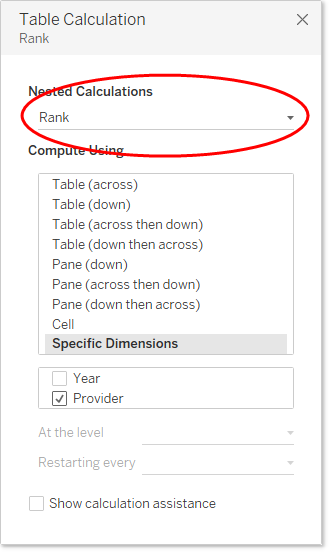 The final step is just pulling the calculations together and testing the Rank filter.
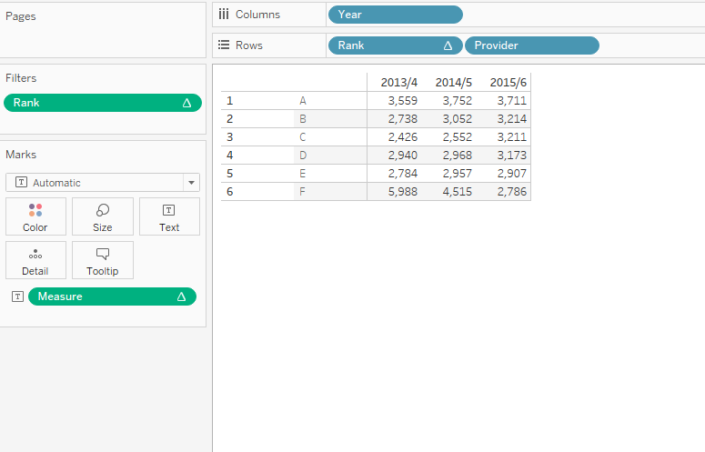 et voila![iframe src='https://public.tableau.com/views/exampleparameterchallenge/EndSolution?:showVizHome=no&:embed=true' width='550px' height='450px' scrolling='no']
The Problem
The table Adam needed to create is shown below (as a final working solution).[iframe src='https://public.tableau.com/views/exampleparameterchallenge/SolutionDash?:showVizHome=no&:embed=true' width='550px' height='450px' scrolling='no']His starting point was this table on which he had decided to use an Index() function to control the filtering of the provider. The index() function simply numbers the providers in order, Adam's idea was to use the sort of the Index (as in the screenshot below) to control the ordering of the index so that it counted the Number of Records for each provider and numbered the index accordingly.Adam's solution wasn't working because his sorting didn't respond to his dynamic measure.Approach 1: Using a Rank and an IF statement
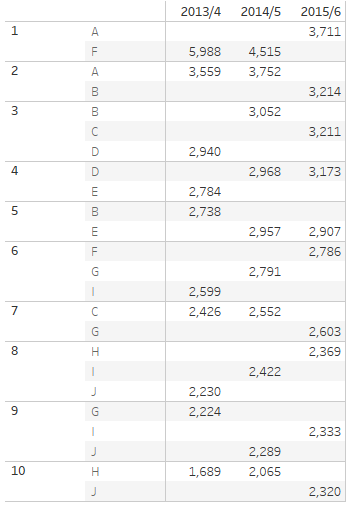
My first approach was to advise Adam to use a RANK() function rather than an IF statement - creating an IF statement statement to apply the rank only to the year we are wishing to sort by.RANK(IF [Year]='2015/2016' THEN [Measure] END)However on implementing this we got this:
Anyone who has spent any time with Tableau will be familiar with this error and so let's explain what is happening and how we can solve it.[Measure] is actually a calculated field consisting of a parameter (to enable the dynamic selection) and three different measures, all of which are aggregations. i.e. they work on the data in some way to sum it, or look at change over time.Whenever we have aggregations in Tableau, e.g. sum([Number of Records]) then Tableau uses what we call the Level of Detail inside the view to decide how to calculate them. The level of detail in the view is determined by the Dimensions we've used in the view, on either Rows, Columns or the Marks pane.In this view we need to find the Dimensions in order to work out the level of detail. It's important not to confuse these Dimensions with the blue 'Discrete' fields. Dimensions in Tableau can be Continuous (Green) or Discrete (Blue). The way to spot a Dimension is to look for the lack of the sum() or other aggregation including ATTR(), an AGG(), or a Δ symbol (all of which signify measures). Remember that you can change fields from Dimensions to Measures (and vice versa) in the view and so relying on whether a field is in the Dimension or Measures pane will not help all the time.Three examples of measures are shown below (signified by AGG, Δ and SUM respectively).Anything else (blue or green) is a Dimension. In the Adam's view the dimensions are Year and Provider.Therefore we can say our data is at the Year and Provider level. Any other measures will be aggregated up to the Year and Provider level by Tableau in order to work out their values.What does that have to do with our error Cannot mix aggregate and non-aggregate comparisons or results in an IF expression?In this case we have our aggregate (the [Measure] field) and we're mixing it with our [Year] field. The [Year] field is a row level value (i.e. at the same level as our original data) and so is not aggregated. The [Measure] field is an aggregation and so needs to be calculated at the Level of Detail of the view. Tableau therefore rightly complains because it can't mix these two values - one is a row value, the other is dependent on aggregating the data up to Year and Dimension.One possible way to solve this problem would be to change the [Measure] aggregation to be at the row level. Doing this involves using what is called 'Level of Detail' (LOD) calculation in Tableau, FIXED. This calculation will perform the aggregation in question for you in a temporary table and then put join it back onto original data so that it exists at the row level. However FIXED calculations can only deal with simple aggregations like sum and average and so I immediately ruled these out as a possible solution.Therefore we need another solution, we need to change the [Year] field, which is at the row level into an aggregation. But how do we aggregate a Year value? The usual options of SUM and AVG are not possible here because Year isn't a value we want to sum or divide. So we need to use aggregations such as MIN or MAX.Remember that when we aggregate the Year we will move it up to the level of detail in the view, which in this case is [Year] and [Provider]. Therefore when we aggregate the Year then MAX(Year) will be the same as MIN(YEAR) . If that is difficult to understand then consider the table below, this shows the data at Year and Provider level. We are calculating the MIN(Year) in the middle of the table for each value at that level of detail. The table would look the same if we were calculating MAX(Year).In Tableau we can also calculate the ATTR (attribute) of a value. This is a special value that simply says if the Max=Min then return the value otherwise return a * (a star).Therefore you will often see people adding a MAX or a MIN or (the clever ones) using a ATTR. When the value is at that Level of Detail they are all equivalent.So to going back to our error:We can solve this three ways, these are all equivalent:RANK(IF MIN([Year])='2015/2016' THEN [Measure] END)RANK(IF MAX([Year])='2015/2016' THEN [Measure] END)RANK(IF ATTR([Year])='2015/2016' THEN [Measure] END)The calculation now works but the result though isn't what I expected.
Approach 2: Solution
Our last approach at the problem failed because the RANK calculation couldn't calculate a RANK for the NULL values the IF statement returned. Removing the IF though isn't a solution because we either have to rank providers across all years, or rank providers and years (neither of which work as you can see below).[2015/16 Value] = IF First()=0 then [Measure] ELSE Previous_Value() ENDI'm using first() here which returns the distance to the first value in our computation. When we're on the first value first() returns 0, for the second it returns 1, for the third 2, etc. So this calculation is saying 'If we are at the first item then take the measure otherwise take the value for the previous item'. So for the first year we'll take our measure, for the second one we'll repeat that measure, etc.Now we just need to 'compute' that calculation across each year, for each Provider ensuring we start with the Year 2015/16 (i.e. the last year in our dataset). When we do this we are creating a nested Table Calculation. Remember Adam's original measure calculation used % change calculations over the years and so there are other table calculations already in the view; we are now adding our own Table Calculation on top of those. Therefore we need to pay attention to the Nested Calculation selector to ensure we are altering the correct calculation:
At the bottom we are ensuring we step through the years in the right order by using a custom sort. Remember that our Year Maximum and Minimum don't matter at this level of detail, and so the only important factor aside from them is the Descending to ensure we start with 2015/16. You can see below this does what we need because when we add it to the label it returns the same value for each year.Once we've done that then we need to RANK([2015/16 Value]) along the Providers. Again we create the calculation and make sure we use the correct nested calculation, computing the ranking for Providers:et voila![iframe src='https://public.tableau.com/views/exampleparameterchallenge/EndSolution?:showVizHome=no&:embed=true' width='550px' height='450px' scrolling='no']Conclusion and Takeaways
There are other ways of solving this problem - I'd love to hear from others on how they'd approach it. I encourage people to download the workbook with this article above and build out the solution themselves. Though the description above seems verbose the actual solution isn't too complex, working through the problem will help cement any learnings in the approach.There isn't a framework to solving these problems in Tableau, but your approach can help enourmously. Your top takeaways from this post should be:- Take time to understand Tableau Fundamentals such as Discrete and Continuous Pills vs Dimensions and Measures
- Take time to understand why Tableau errors, understanding why something doesn't work is the first step in understanding any potential solution
- Formulate a solution around what you want to happen, here we need a field that was the same for each year.
- Take time to learn more advanced Tableau Calculations like first(), last() and previous_value() and practice using them. Experiment and see what they do. Play with option to understand what Tableau is doing.
- Ask for help! Use Tableau partners, Zen Masters and the Tableau Community to understand why Tableau works the way is does. Don't just ask for solutions, aim for understanding.