 I’ve seen a couple of questions recently on how to visualise account balance data whilst still being able to use the date aggregation in Tableau. Because balance represents a snapshot in time, it is nonsense to sum up all the balance values over a year or a month. The average or maximum or minimum over a period might be useful but what was really wanted was the balance at the end of a certain time frame – i.e. balance at the end of 2009, balance at the end of February 2010, the balance at the end of Q3 2007 etc.
This post looks at one way to achieve this using a table calculation called “LAST”. LAST will look at the order of your data and label them backwards, giving the last data point a zero and the second to last a one and so on.
Before we start, it is important to make sure your data is in the correct format. Firstly, there must be a unique identifier for each row – usually this will be the date/time record for the account balance, but there cannot be multiple entries for 17/10/2012 unless you have a time element to the field as well (i.e. 17/10/2012 09:30:00 and 17/10/2012 10:00:00 etc.). Secondly, as with preparing all data for use in Tableau, make sure there are no gaps, subtotals, summarised tables etc. See more on the subject in this Knowledge Base article here.
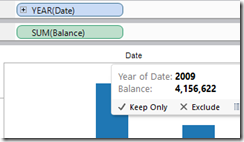
1. Connect to your data and ensure that your date/time is a dimension and Balance is a measure. Try adding Date to the columns shelf and Balance to the rows shelf and change the mark type to a bar chart.
By default, Tableau will sum up all the balances per year which is obviously wrong. We need to tell Tableau to only sum up the last balance per year and that’s where the LAST function comes in.
 2. Create a calculated field called ‘Last’ and write the formula LAST() in the box and click OK.
3. Change this field to be discrete by right clicking it and selecting ‘Convert to Discrete’
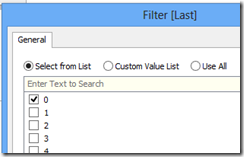
4. Add this field to the filters shelf and select 0 from the options available
Whoa, that’s not right! What we see now is the last years’ worth of balances all added up together. Tableau guessed that we meant the LAST data point on the Tableau table on the screen, but we need to tell Tableau that we actually mean the last data point in the Date field, per year. To do this we need to edit the table calculation.
5. Add the Date field to the level of detail shelf and change it to show Exact Date
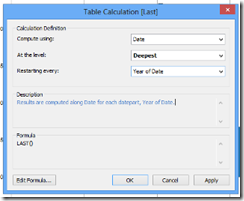
6. Click on the Last pill on the filter shelf and select Edit Table Calculation
7. In the dialogue box, change ‘Compute using:’ to Date and ‘Restarting every:’ to Year of Date and click OK. Reselect 0 from the filter box if it reappears.
Hey presto, we now have the balance at the end of each year! If we want to show per quarter, go into the Edit Table Calculation dialogue box again and change ‘Restarting every:’ to Quarter of Date. For months, change it to Month of Date and so on.
If you want it to be a bit more slick and interactive for your users to change the level of granularity, you can add a parameter and a calculated field which returns the “datepart” depending on what is selected in the parameter. The LAST table calculation should then be set to ‘Restarting every:’ datepart. See the below viz for a closer look.
Not how you’d do it? Add a comment below or get in touch.
