

2 November 2017
BrightTALK event
Few months ago I spoke at one of the BrightTALK webinars presented by Andy and Eva about predictive analytics and how to apply machine learning methods using Tableau - Alteryx - Exasol software.The webinar looked at some examples of predictive analysis and showed some data visualization examples that are actionable and can drive further questions and discussions in an organisation.If you have miss it click here to see the recorded video.This blog
Here I want to explain in detail the Alteryx bit which run a 12 months forecast of UK opioid prescriptions showing a strong decrease in most of the regions but not everywhere.How can we run a time series forecast in Alteryx?Well first let's talk about forecast in general.What’s a time series forecast?
Time series forecasting is the use of a statistical model to predict future values, based on past results.What kind of variables can we forecast?Any kind of variables that we have collected in the past!The predictability of an event or a quantity depends on several factors including:- How well we understand the factors that contribute to it;
- How much data are available;
- Whether the forecasts can affect the thing we are trying to forecast.
Data
I use a prescription dataset from Exasol database.In Alteryx when we work with data from a database connection, we can choose between streaming data out into Alteryx or working directly in DB with the In-Database tools. In-Database enables blending and analysis against large sets of data without moving the data out of a database and can provide significant performance improvements over traditional analysis methods.I use the Connect In-DB tool to connect to the prescriptions table in Exasol database.
 Data looks like this: we got some drug names, quantity by period and practice address.
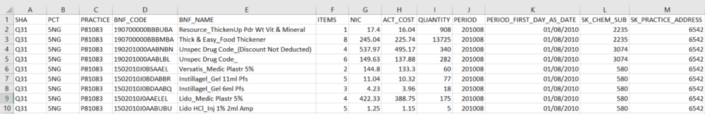 Now I want to filter my data to opioids only and get rid of everything before 2012, therefore I need Filter in-DB tool and write some SQL:
 'BNF_NAME' LIKE 'Methadone%' OR 'BNF_NAME' LIKE 'Buprenorphine%' OR 'BNF_NAME' LIKE 'Clonidine%' AND'PERIOD_FIRST_DAY_AS_DATE' > '2011-12-31'Now I can use Data Stream Out tool to stream data from Exasol DB out to my Alteryx workflow.
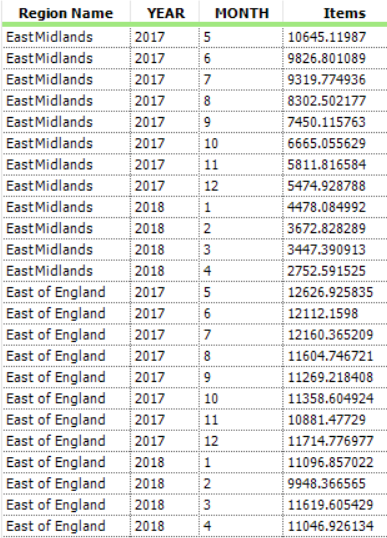
 Now I really want to understand where are these practices geographically and all I have in my data is the SK_practice_address (it's a sort of address code). I can join that code to another table in Exasol database and after some cleaning (summarizing, transforming date from string to month and year) I get regions, items, year and month (some regions are null(), this is because some practice_address code didn’t match).
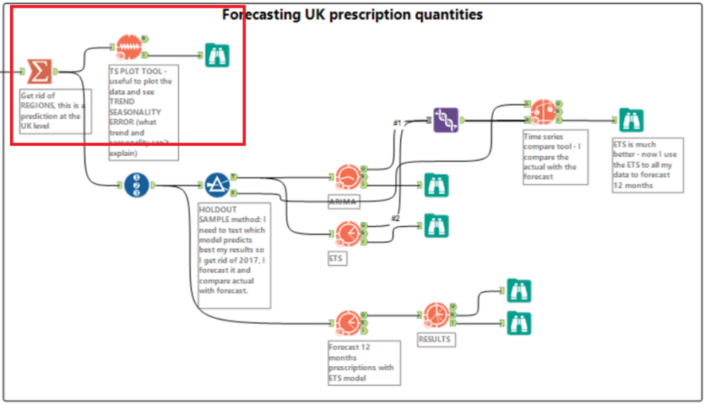
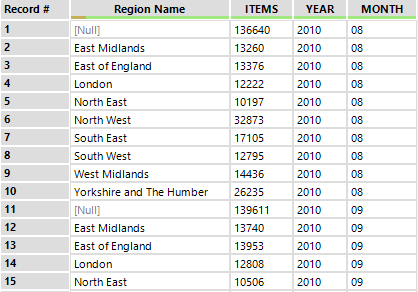 I showed this workflow part to my colleague Andre and he managed to improve the performance of it doing all steps directly in DB without streaming data out (he will write a blog soon about this, right Andre?).Now let's run two types of forecast:UK level UK regions level
But wait… what’s a good forecast?
Good forecasts capture the genuine patterns and relationships which exist in historical data but do not replicate past events that will not occur again.Good forecasts assume that the way in which the environment is changing will continue into the future (an economy that has gone through booms and busts will continue to go through booms and busts).A forecast model wants to CAPTURE THE WAY THINGS MOVE, NOT JUST WHERE THINGS ARE.The forecaster’s toolbox
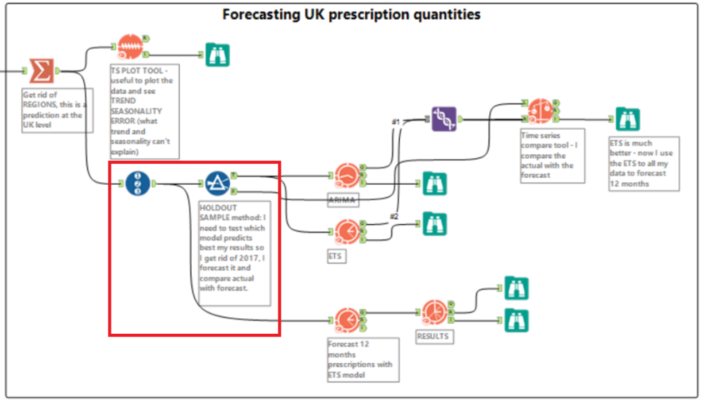
One of the first thing to do in any data analysis task is to plot the data. Graphs enable many features of the data to be visualized including patterns, unusual observations, changes over time, and relationships between variables.1. UK level forecast
Let’s plot our data and see how UK opioid prescription quantities look like between 2012 and 2016.Let’s use the TS tool to decompose the time series in:
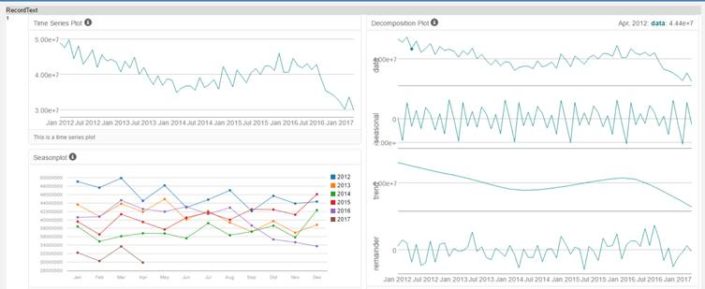
- Trend
- Season
- Error (difference between the observed value and the trend line estimate; it’s the piece that’s not accounted for by combining the seasonal piece and the trend piece. All time series will have the error to explain what trend and seasonality cannot).
 Now let’s talk about ETS & ARIMA models.
ETS – what is it?
Exponential smoothing forecasts uses weighted averages of past observations giving more weight to the most recent observation with weights gradually getting smaller as the observation gets older.E, T & S terms represent how error, trend and seasonality are applied in the smoothing method calculation. Each term can be applied either additively, multiplicatively or in some cases be left out of the model all together.How do we identify additive or multiplicative terms? Visualizing the data doesn’t seem very scientific but it’s the most powerful way to see the trend.- Additive method is useful when the trend and seasonal variation are relatively constant over time (linear trend).
- Multiplicative method is useful when the trend and seasonal variation increases or decreases in magnitude over time (exponential trend).
ARIMA – what is it?
Autoregressive integrated moving average, it's like linear regression with the predictive variables as numbers of periods of the time series used in the calculation.How do we decide which is the best model?
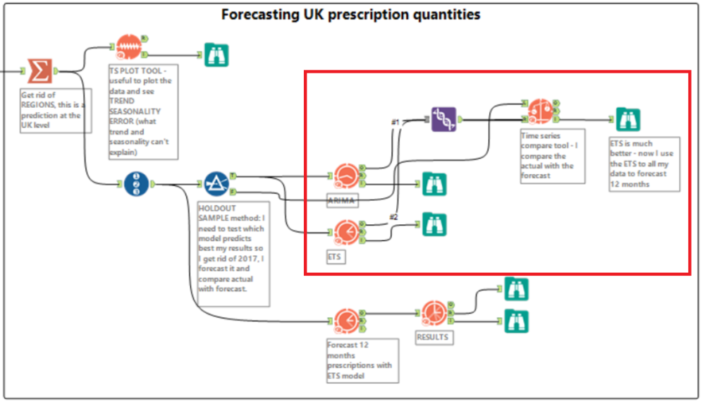
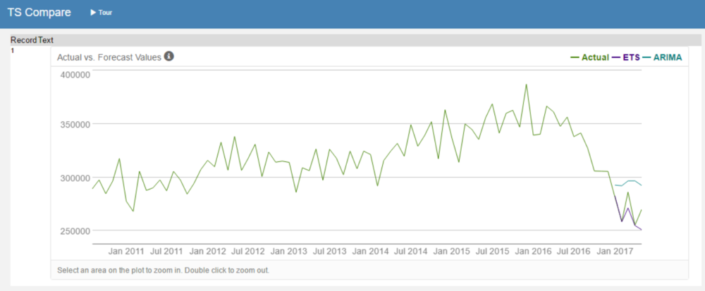
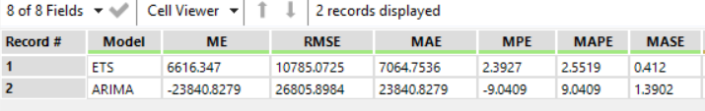
I use TS compare tool so I can visually see which one of the two models are able to best follow the trend. We can see that ETS is much better than ARIMA, also less visual we can check the RMSE (Root mean square error), ARIMA has a higher error than ETS.
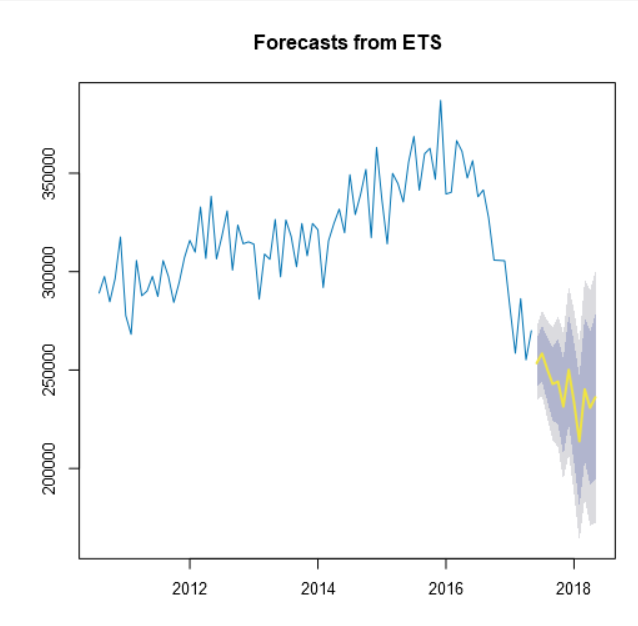
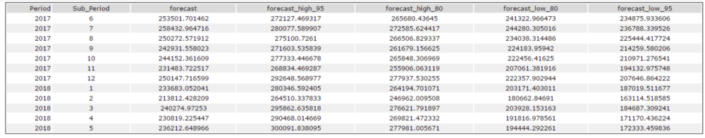
 So now let’s forecast 12 months prescriptions using the all dataset and the ARIMA model. Now we need TS forecast tool so that we can finally forecast 12 months time series.
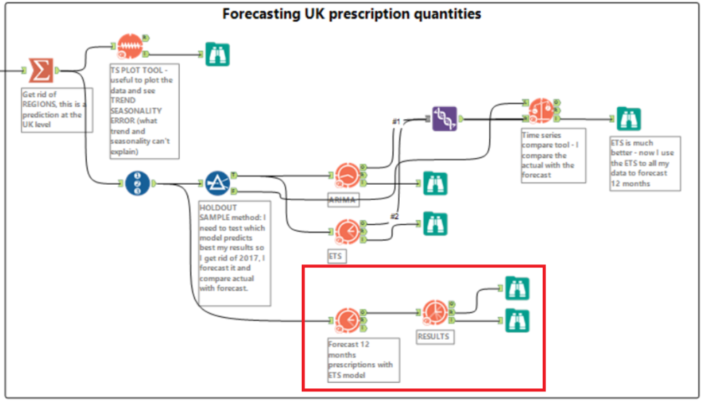
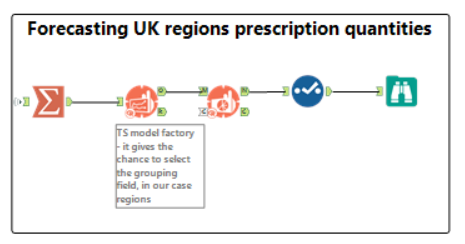
UK region level forecast
- TS Forecast Factory
- TS Model Factory
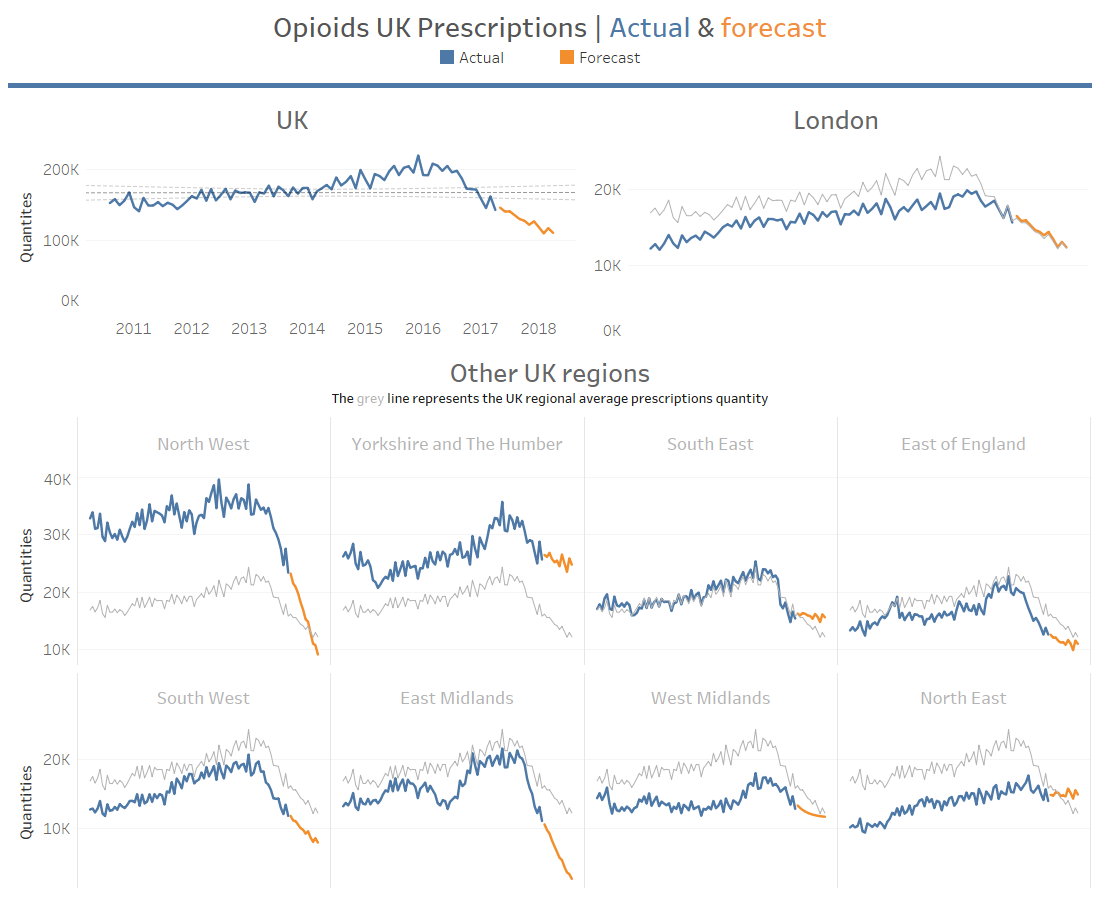
 Now I really want to visualise my results in Tableau, therefore I use the union tool to append the forecasted values with the actual values.In Tableau:
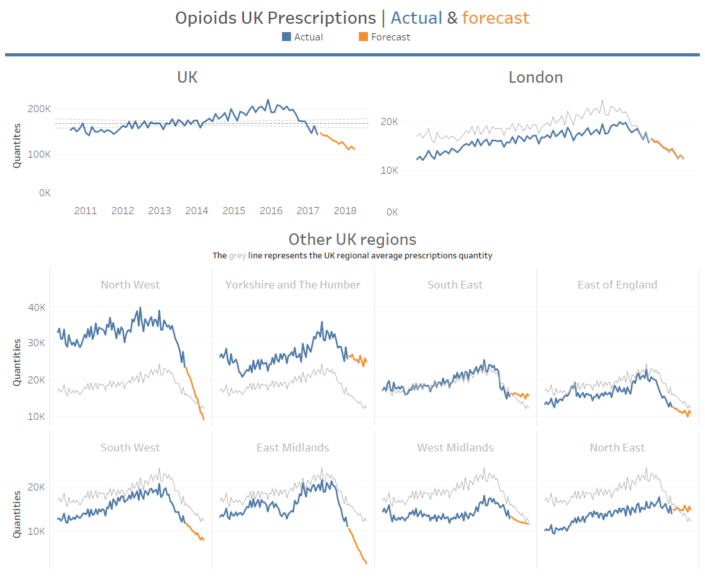 If you like this blog and you want to learn more about forecasting in Alteryx click here.For the Alteryx workbook click here.For the Tableau workbook click here.Thanks!