

15 May 2015
This past Wednesday, The Information Lab team hosted nine candidates for the first class of our upcoming Data School. To say the pool of candidates was outstanding would be a huge understatement.We had two spots remaining in the school for which this pool of nine was competing. We conducted a two part interview, each 15 minutes in length, all in quick succession… speed-dating meets The Apprentice!
- Each candidate went through a more traditional-type interview with Tom Brown and Jonathan MacDonald.
- Each candidate gave a demonstration of the analysis they did in Tableau to Robin Kennedy and me.
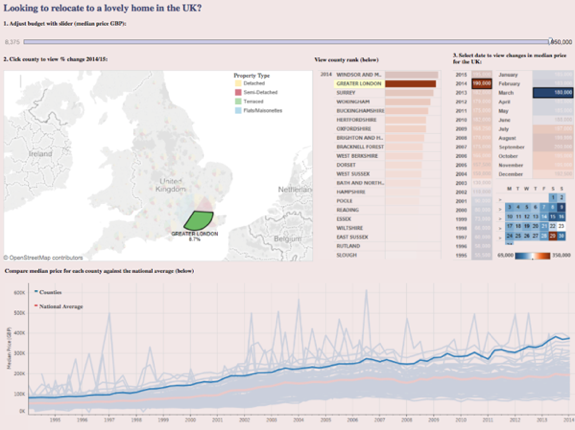
- Create a visualization, story, series of dashboards, whatever...
- Publish it back to our Server
- Insights
- Good storytelling (this doesn’t mean you need to use story points)
- An engaging visualization
- Demonstration of visualization best practices (given this warning, chart junk will score you low)
- Don’t create something unnecessarily complex; keep it simple and easy to understand
- Sell themselves; this was their chance to make us think we’d crazy not to take them in the School
- Show it to a friend; if they can understand it without asking too many questions, then they probably did a good job
- HAVE FUN!