

14 July 2015
So you have your athletes or players and you have their data, ranging from hydration and saliva scores through to wellbeing questionnaires and GPS data. Each dataset being collected by a different member of backroom staff, all stored in different excel workbooks with athletes being called something different in each workbook. Alongside this you have .csv files from external providers such as Opta, Tracab, Prozone, Catapult and StatSports.And then the question comes from your boss…Is there a correlation between hydration scores and wellbeing questionnaire results?Does the intensity of our training sessions have an impact on match day output?So time to jump into excel and spend your valuable time looking through multiple workbooks, establishing the structure of the workbook, identifying what the creator of the workbook has called each athletes before you go and implement various formulas, including multiple vlookups, along with no doubt a decent chunk of copy and pasting between sheets. Let’s hope you don’t have anything important for the next few hours, like a training session or a match.If only there was a more efficient and quicker way of doing this. Well, there is…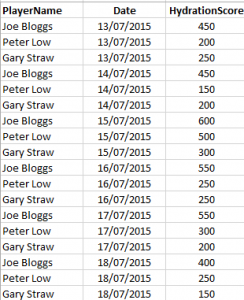 Then you have your csv exports from your GPS technology provider and your match data provider, with each athlete's physical output for each date.
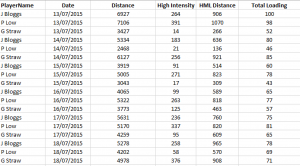
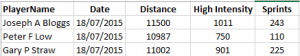 How do you even start to look at these three different sets of data in a holistic and cohesive manner? Particularly when you consider the above examples are just a limited number of metrics for just three athletes for just one week, how would you even go about doing this for say 30 footballers, across 46 weeks with 200+ metrics? Let's find out...
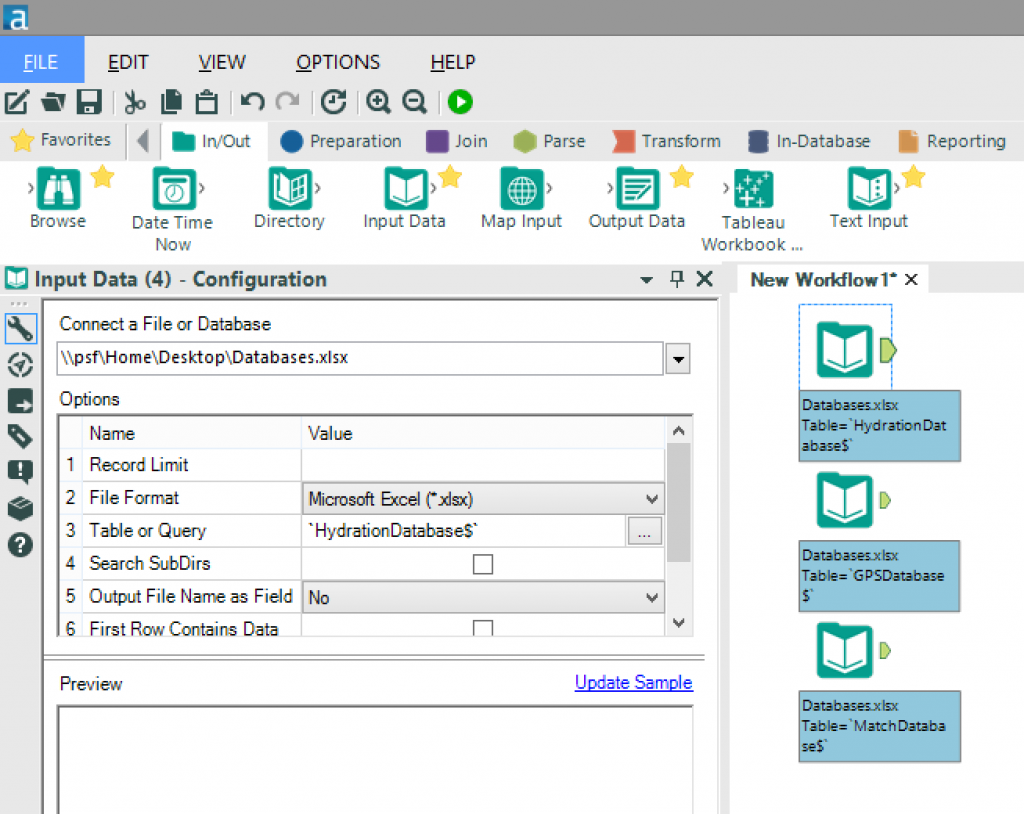 By dragging the “Input Data” tool on to the workflow and selecting the relevant file from the configuration options and repeating this for each database, I have established my three databases.Step Two: I need to make my databases cohesiveAs mentioned earlier, many databases within most sports clubs have different athlete's names for the same athlete, in this example we have Joe Bloggs, J Bloggs and Joseph A Bloggs. So we need to ensure that our final database recognises these three different names as the same athlete. We will do this by creating a unique PlayerID for each athlete.There are numerous ways in which we could do this, but I’m going to approach this using a control database created in Excel.
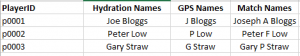 This Excel sheet has a row for each athlete with a unique PlayerID and the various names an athlete is known by. We then need to add this “Names database” to the workflow as below.
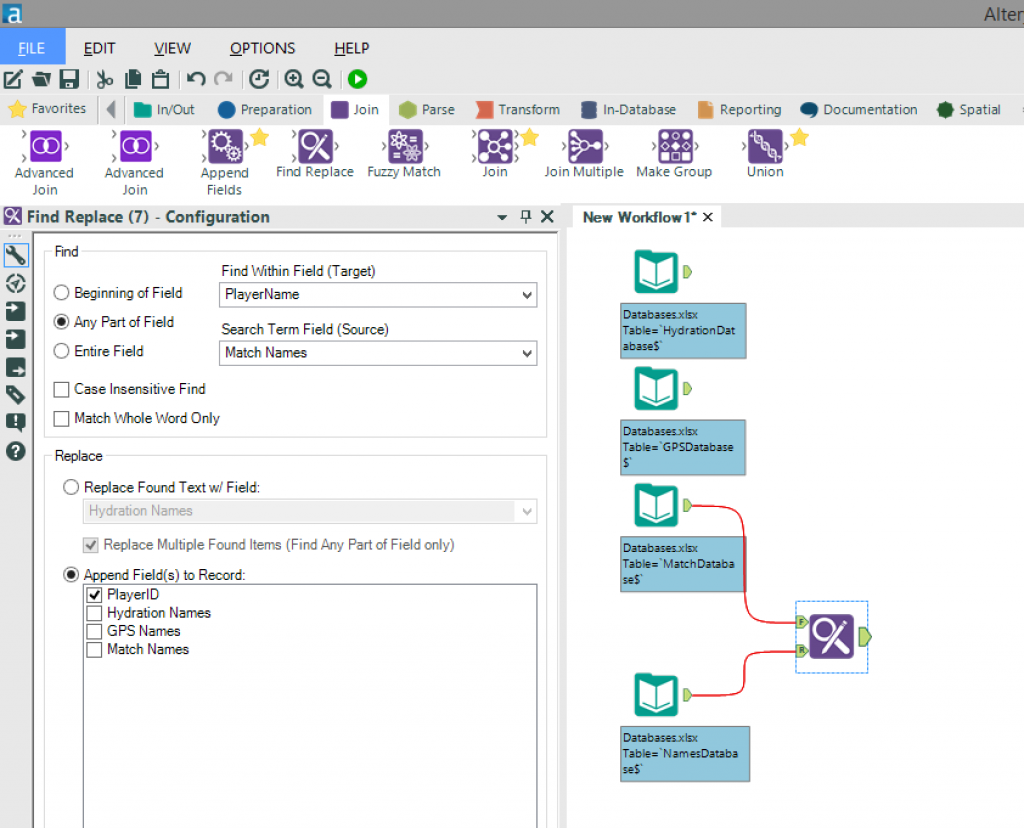 Once we have done this we can use the “Find Replace” tool and connect the databases (hydration, GPS or match data) to the “F” input and the control database (Names database) to the “R” input.Select the target field (PlayerName) and source field (Match Names/Hydration Names/GPS Names) and choose the option to “Append Field(s) to Record” and select “PlayerID”.Once we have done this for each database then we will have a clear unique ID for each athlete(PlayerID).Step Three: I need to join my databases togetherOur next step is to join our databases together so that we have one complete database with all the required metrics as to approach our analysis in an all-encompassing manner.We do this by using the “Join Multiple” tool and join by specific fields. In this case we want to join on our newly created “PlayerID” field as well as the “Date” field as shown in the configuration window below.
 You will also see that I have used the configuration window to remove some unwanted fields by unticking them due to the fact that they are the various names for each athlete in each database and also a “Date” field is being carried through from each of the original three databases.To finish this configuration I have also renamed (by typing in the “Rename” column) the GPS and match database fields as to ensure the end user can clearly distinguish between training output and match output.Step Four: I need to visualise my dataOur final step is to output our new database as .tde ready for use in Tableau.Here we use the “Output Data” tool and select the location to write the file to along with the and file format (.tde).
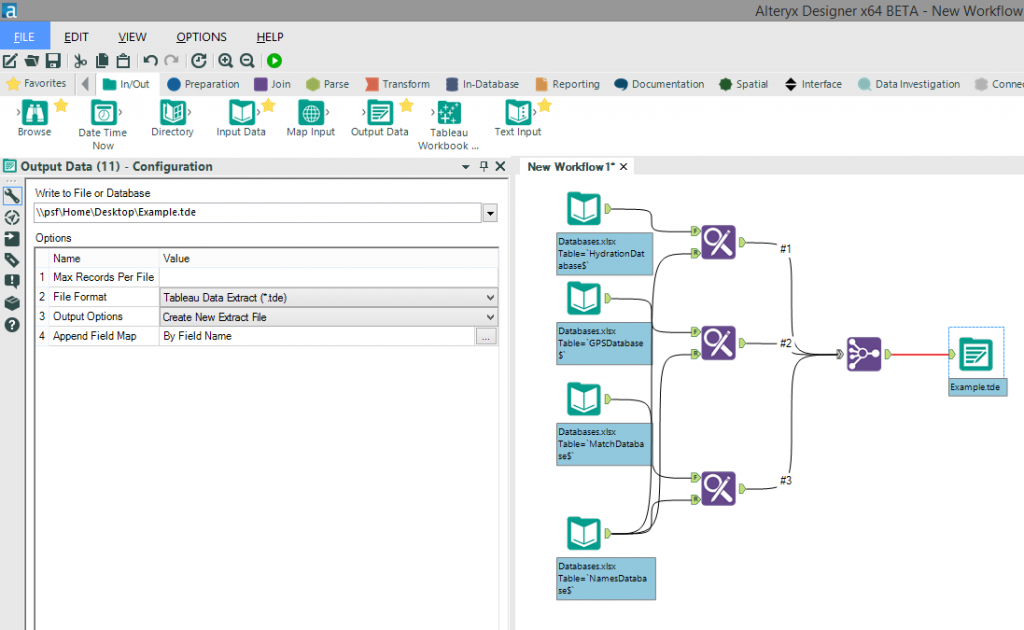
Welcome to Alteryx
Firstly, let us understand what Alteryx is in it’s most simplistic form. Alteryx provides a visual means for putting your thought process in to action, much like a flow chart.Before we start, it is important to know of the ideal structure of data in an xls or csv file.For best practice we should have our data in a row-by-row format, where each row contains a new line of information. So in our examples below there is a new row for every athlete and then for each athlete there is a new row for every date. We then have data about one piece of information in each column (ie. hydration score, distance etc…).We should have the data in as granular (unaggregated) format as possible to allow us to explore the data to a deeper level.Now let’s take a look at this scenario for instance:You have a hydration database completed by your sport science intern, with the athlete's name, the date and their hydration score.Then you have your csv exports from your GPS technology provider and your match data provider, with each athlete's physical output for each date.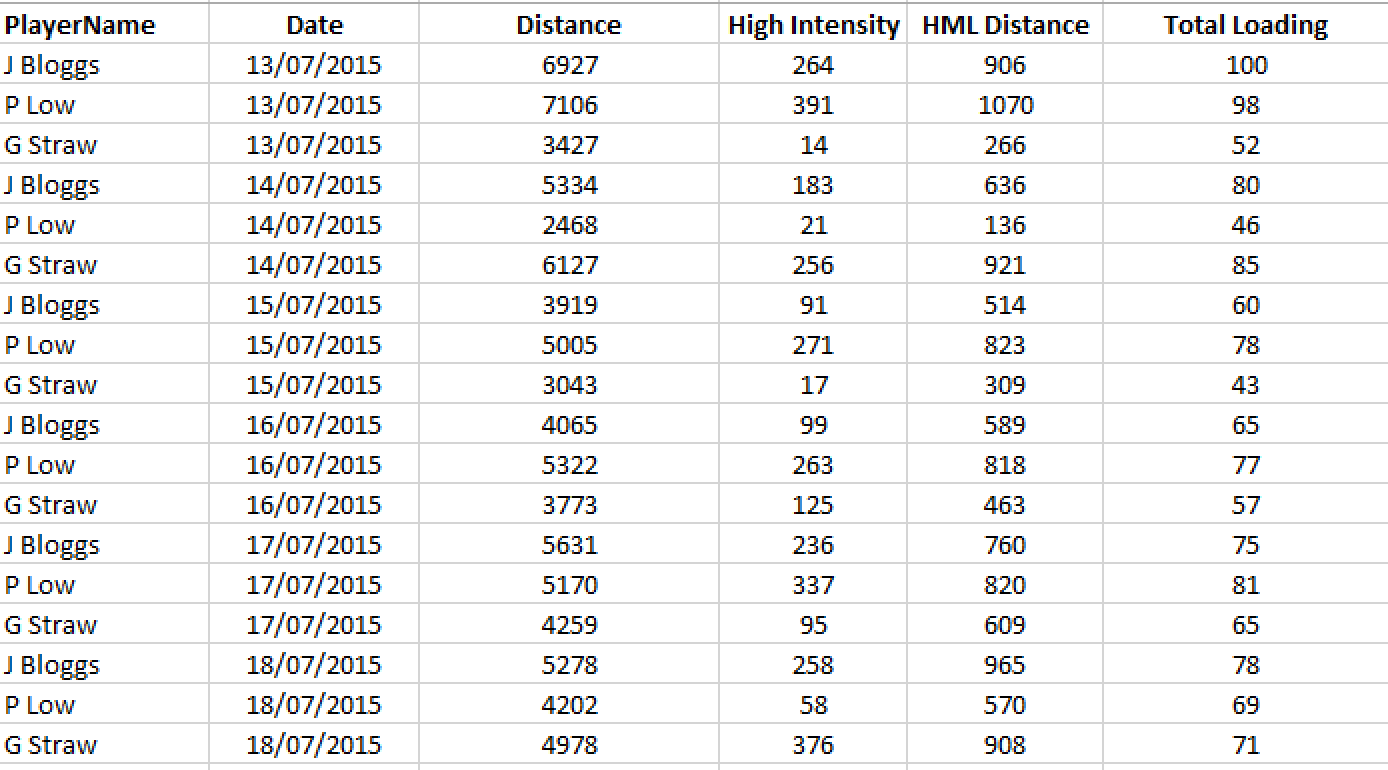
 How do you even start to look at these three different sets of data in a holistic and cohesive manner? Particularly when you consider the above examples are just a limited number of metrics for just three athletes for just one week, how would you even go about doing this for say 30 footballers, across 46 weeks with 200+ metrics? Let's find out...
What do I want to do?
As previously mentioned, Alteryx provides a means for you to visually construct your thought process, so let us approach the above scenario in this way.Step One: I have three databases (hydration, GPS & match data).Let’s introduce these three databases to the workflow then.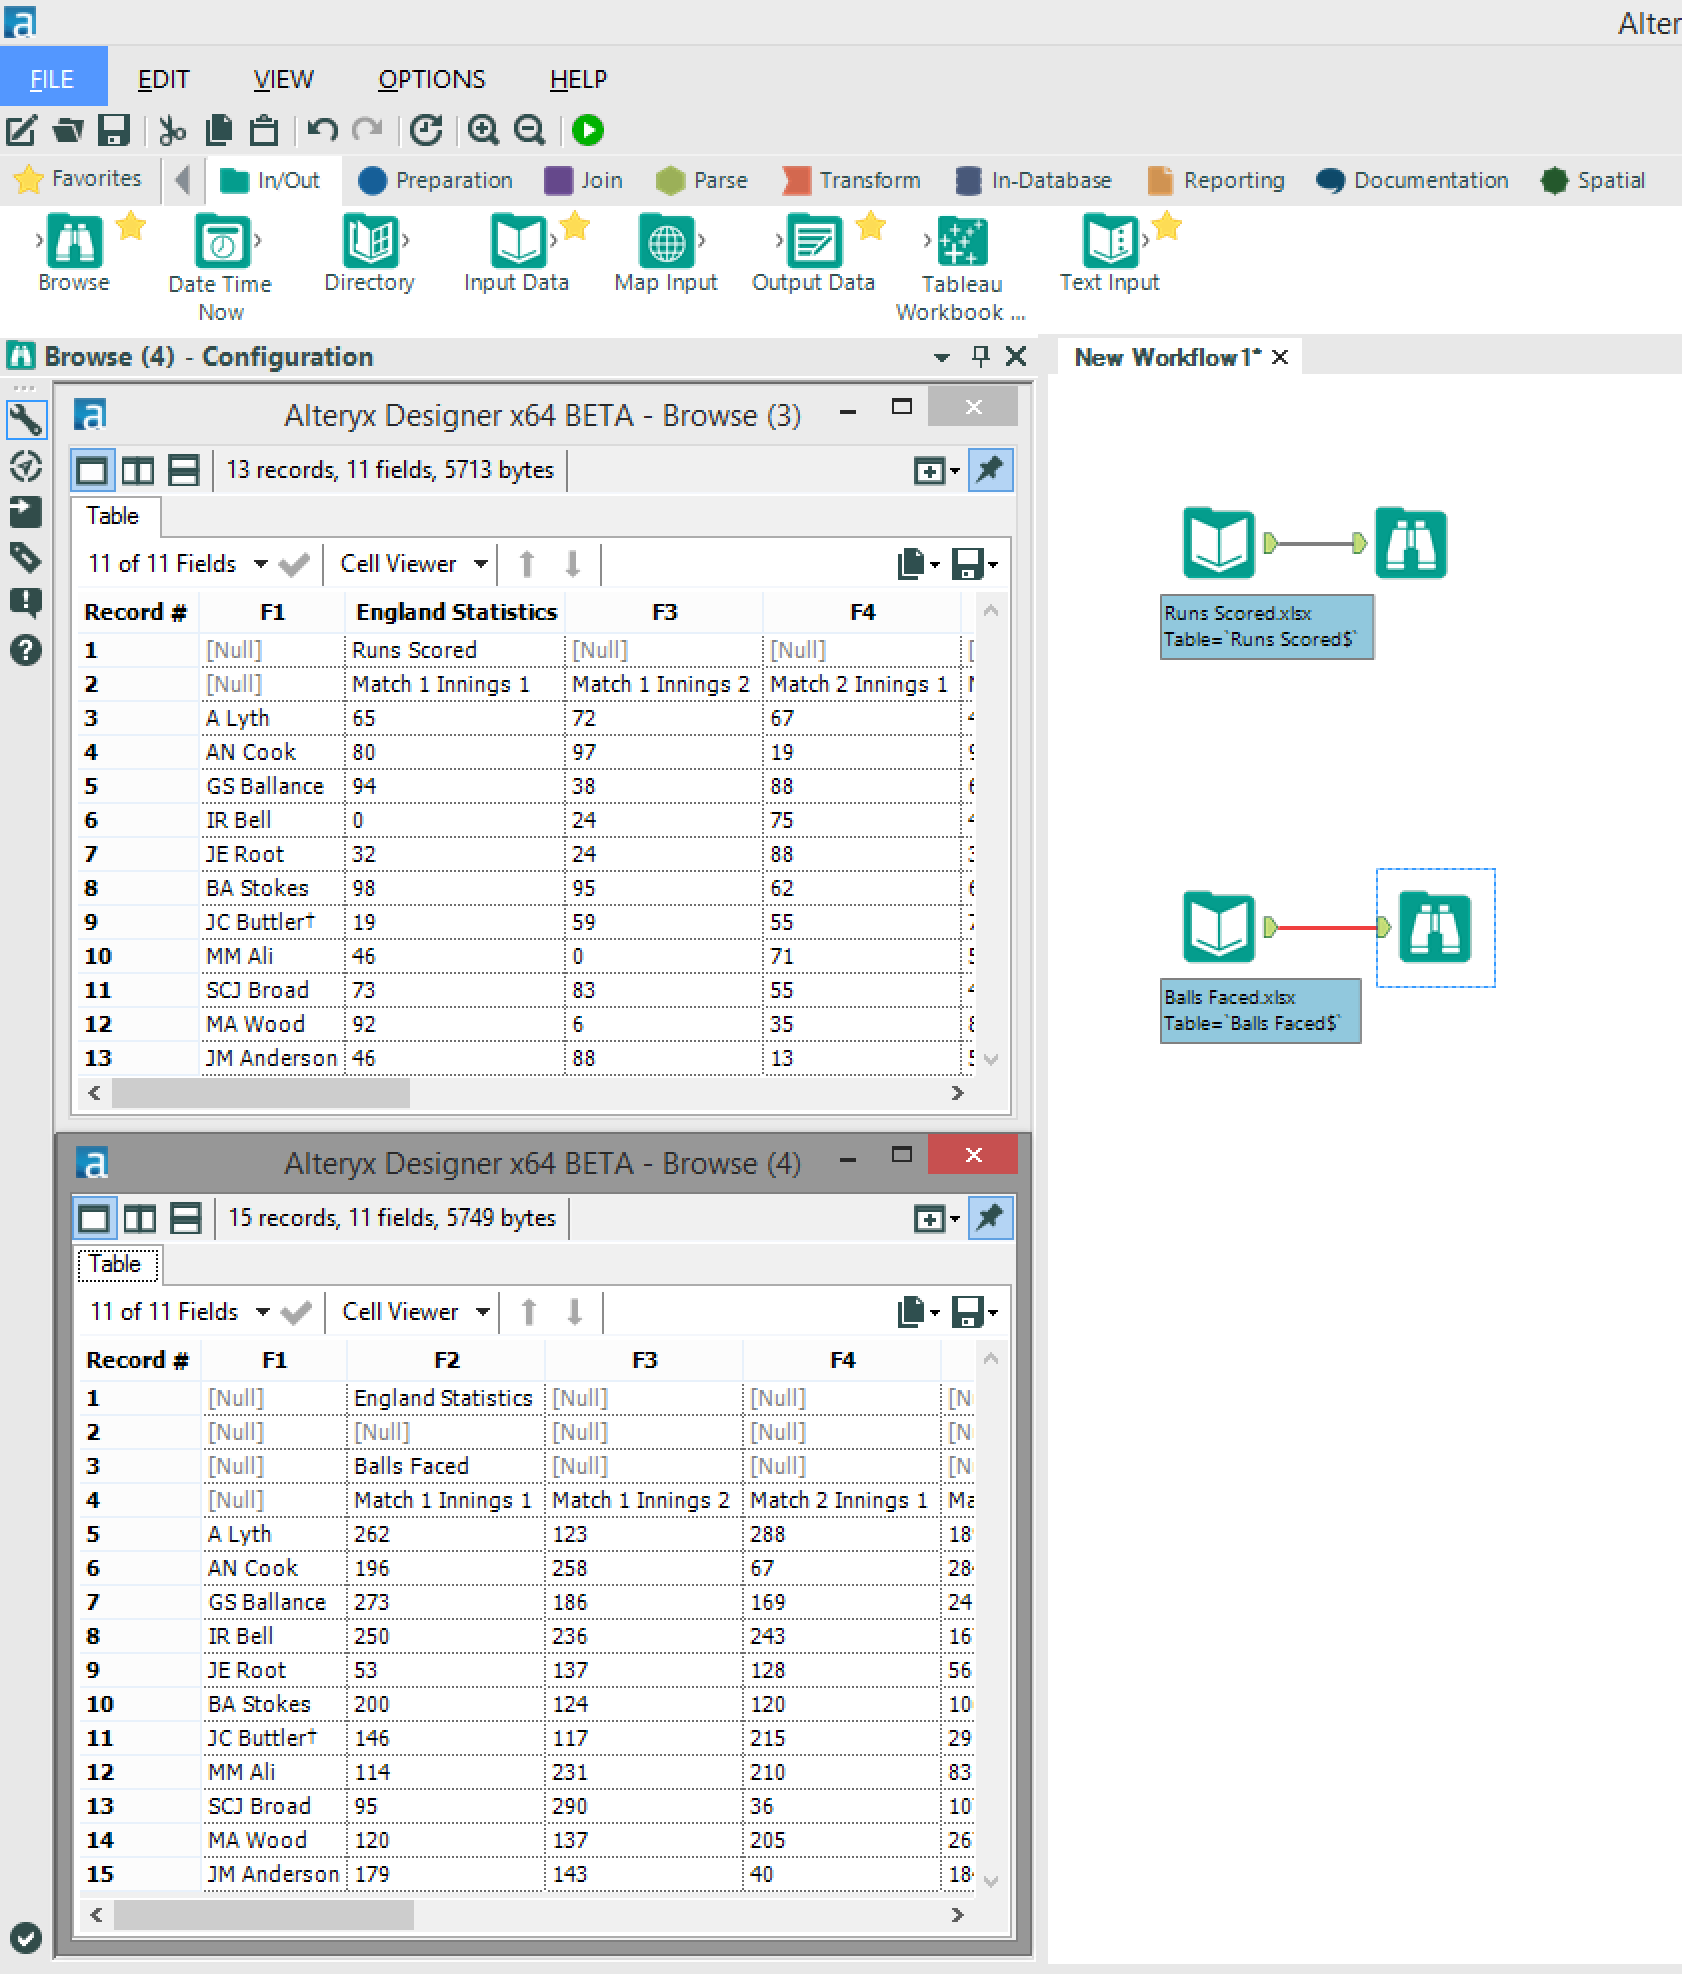 By dragging the “Input Data” tool on to the workflow and selecting the relevant file from the configuration options and repeating this for each database, I have established my three databases.Step Two: I need to make my databases cohesiveAs mentioned earlier, many databases within most sports clubs have different athlete's names for the same athlete, in this example we have Joe Bloggs, J Bloggs and Joseph A Bloggs. So we need to ensure that our final database recognises these three different names as the same athlete. We will do this by creating a unique PlayerID for each athlete.There are numerous ways in which we could do this, but I’m going to approach this using a control database created in Excel.
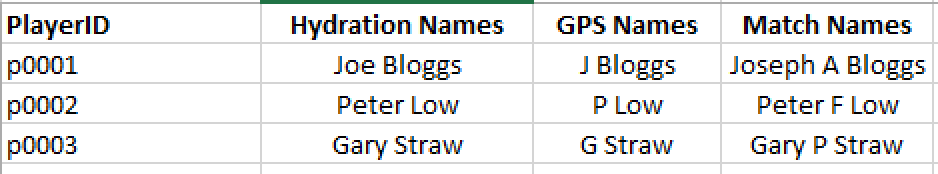 This Excel sheet has a row for each athlete with a unique PlayerID and the various names an athlete is known by. We then need to add this “Names database” to the workflow as below.
 Once we have done this we can use the “Find Replace” tool and connect the databases (hydration, GPS or match data) to the “F” input and the control database (Names database) to the “R” input.Select the target field (PlayerName) and source field (Match Names/Hydration Names/GPS Names) and choose the option to “Append Field(s) to Record” and select “PlayerID”.Once we have done this for each database then we will have a clear unique ID for each athlete(PlayerID).Step Three: I need to join my databases togetherOur next step is to join our databases together so that we have one complete database with all the required metrics as to approach our analysis in an all-encompassing manner.We do this by using the “Join Multiple” tool and join by specific fields. In this case we want to join on our newly created “PlayerID” field as well as the “Date” field as shown in the configuration window below.
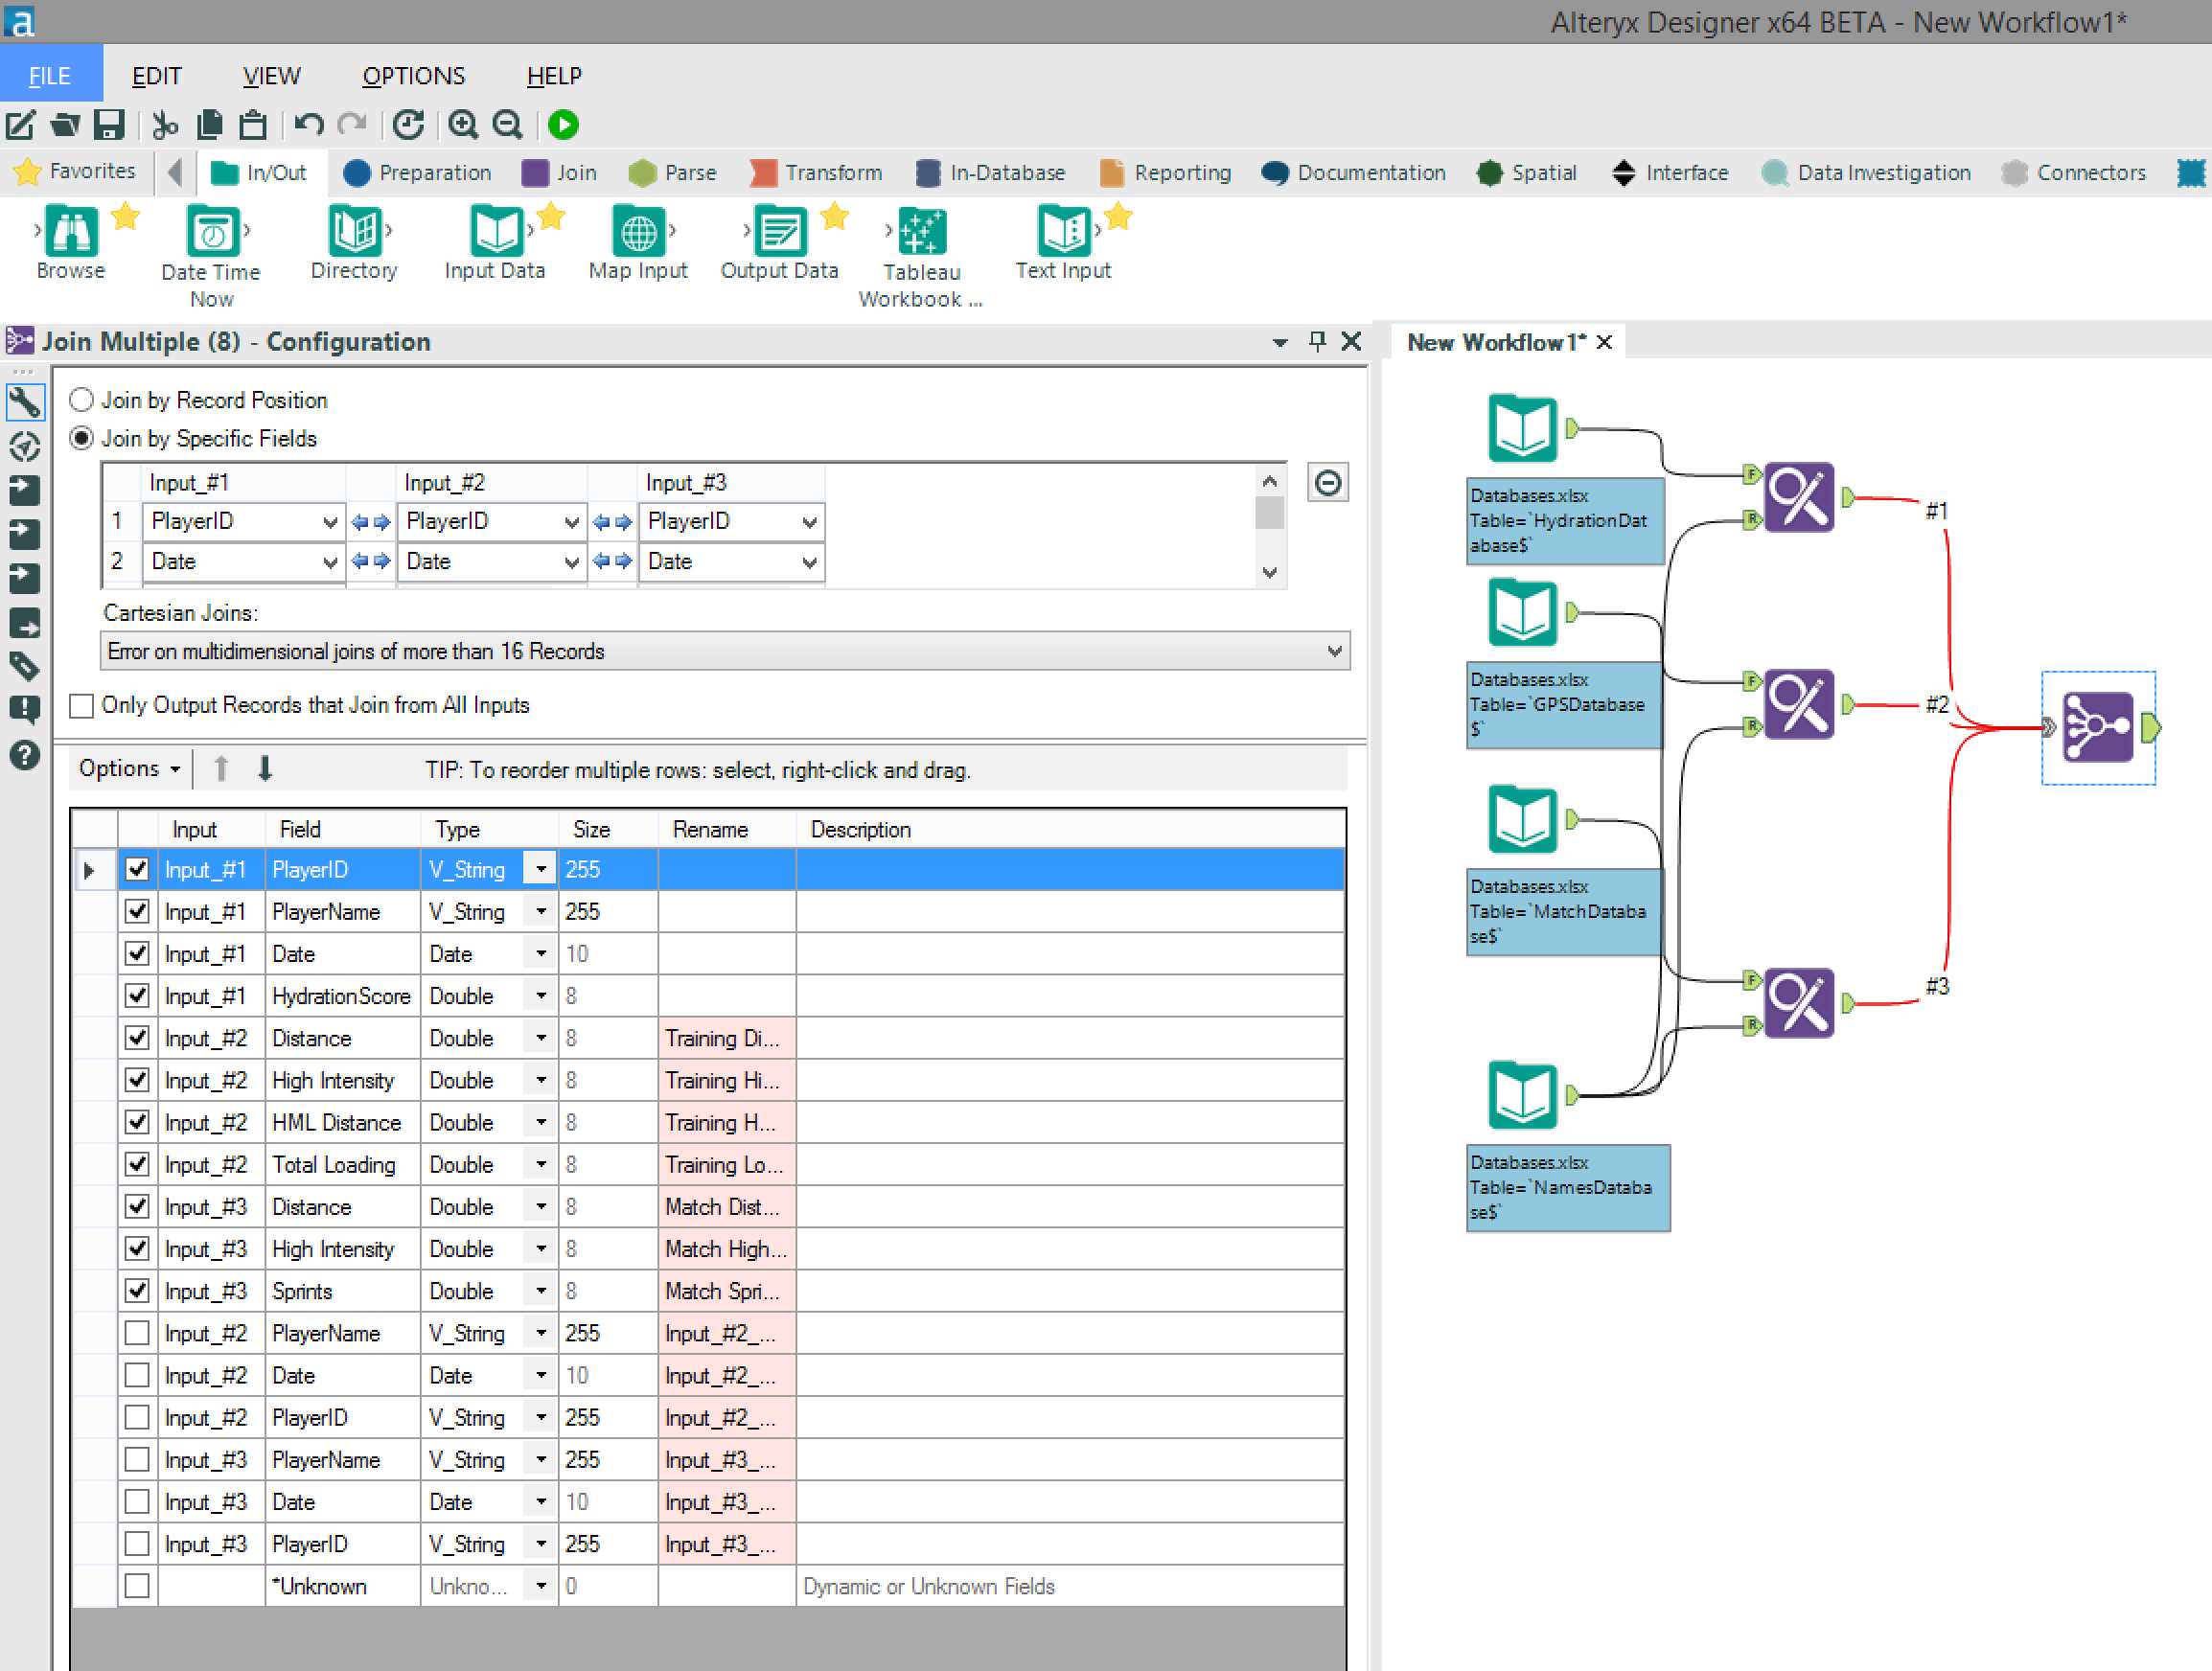 You will also see that I have used the configuration window to remove some unwanted fields by unticking them due to the fact that they are the various names for each athlete in each database and also a “Date” field is being carried through from each of the original three databases.To finish this configuration I have also renamed (by typing in the “Rename” column) the GPS and match database fields as to ensure the end user can clearly distinguish between training output and match output.Step Four: I need to visualise my dataOur final step is to output our new database as .tde ready for use in Tableau.Here we use the “Output Data” tool and select the location to write the file to along with the and file format (.tde).
Success
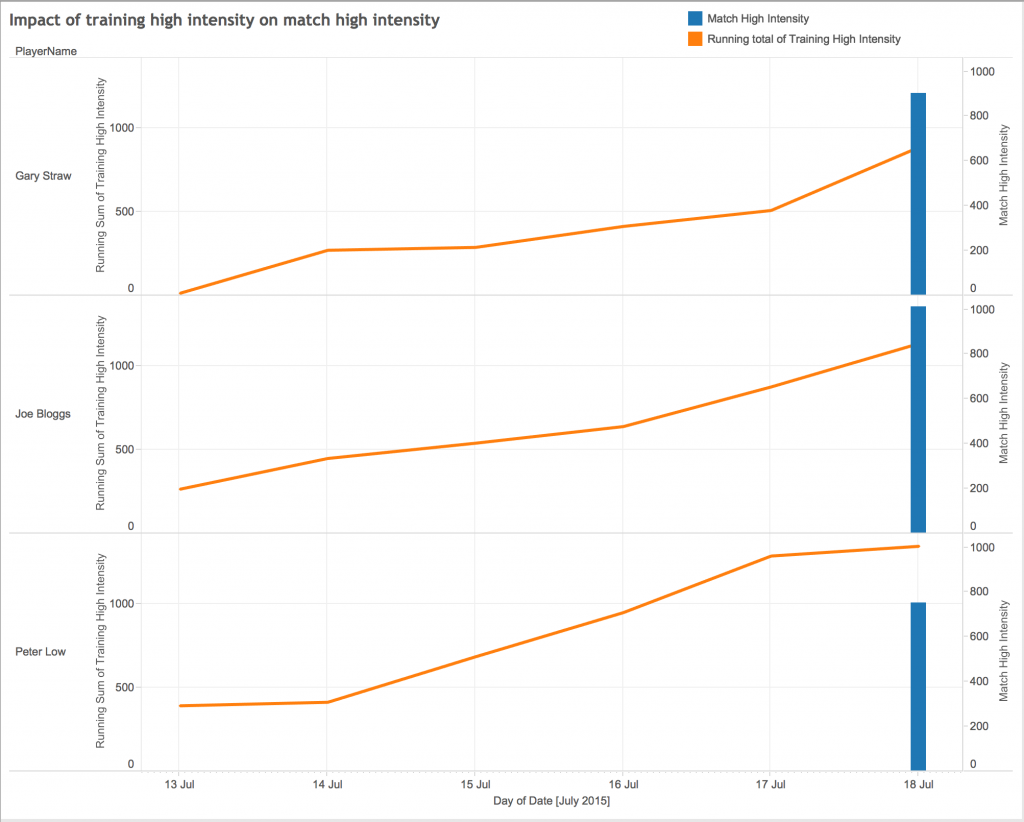
And there we have it, you now have a workflow that combines all of your sports data together in to one comprehensive database, allowing for a greater level of analysis to be carried out within Tableau, leading to greater insights and a deeper understanding.