

Earlier this month, we unveiled a fresh new look for The Information Lab's website, and to be honest, it was long overdue. Our last site design wasn’t created a decade ago although for many of us it sure did feel like a bit of a relic. Since the company was founded the Information Lab website has gone through a number of iterations with each version telling a different story.
It started off as a Squarespace site before Squarespace was ever really a thing. Unfortunately there aren’t any screenshots of the site back then, even the wayback machine didn’t bother itself to keep a hold of the stylesheet needed to see how it looked. All we know is it contained many generic “consultancy” images like:

Most important of all was the introduction “Welcome to a new type of business intelligence consultancy. One that believes everyone should have instant access to data and that exploring complex data sets should be a pleasure.” At the time the company was just one person, Tom Brown, and around that belief gathered a group of data geeks who shared the same passion for data. They believed data should be easy to work with, the analysis simple to understand and they were adamant you could have fun doing it.
The second most important part of that first site wasn’t actually directly communicated, although it was written down, and that was the site’s blog. The ethos then as it is today is if you want to cement your learning you have to teach it to others. As the company was getting started Tom was keen to learn every aspect of Tableau, not just how to use it but also how it could be used. So to cement that learning he blogged frequently about topics ranging from the meaning of blue and green in Tableau to the speed of exploring data with charts to more complex topics like table calculations. His content became widely shared and known by every new user of Tableau.
The next generation of the website saw the launch of the Tableau Hub, a repository of all resources we love to use and reference. We said goodbye to Squarespace and relaunched using Wordpress.
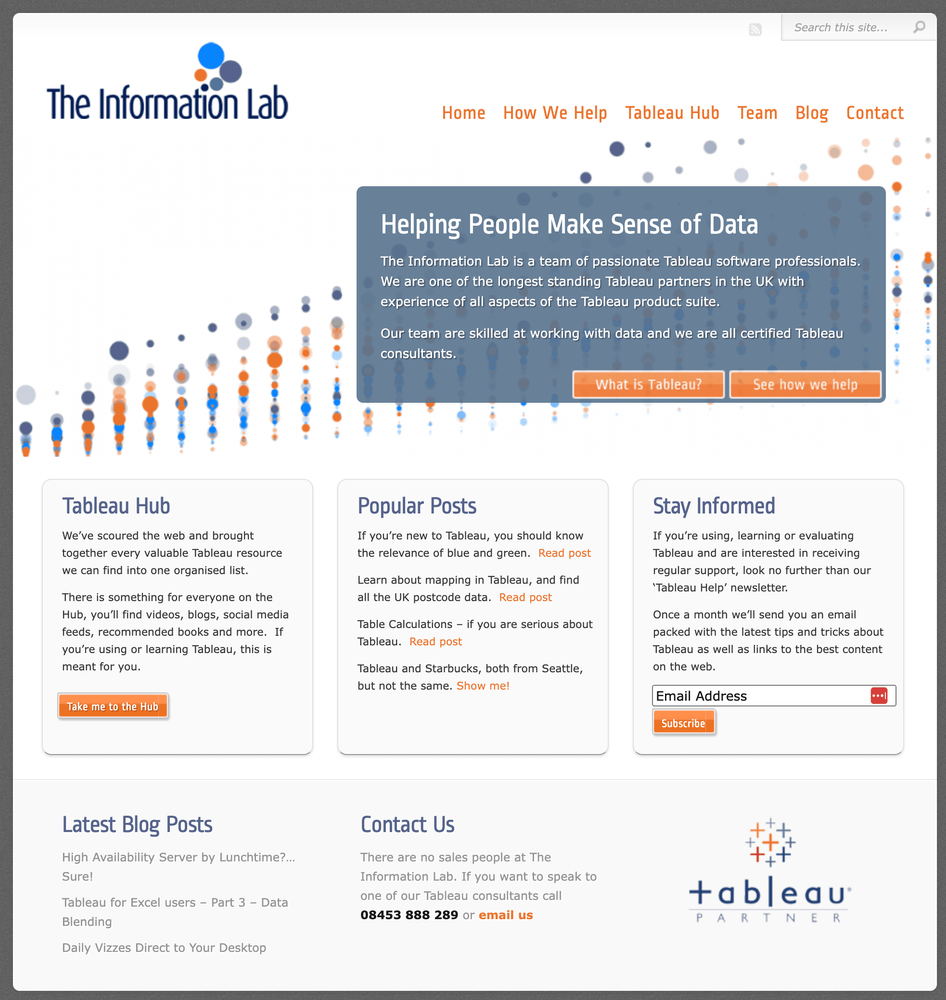
The Tableau Hub was prominently displayed on the front page along side our most popular blog posts with…you’ve guessed it…the description of blue and green pills ranked number 1. For those interested there were two people at The Information Lab at the time with “plans to be 5 consultants by the end of 2012”.
By the start of 2016 The Information Lab had grown to 35 employees in the UK with 50 in total across 5 offices in Europe. We had written 337 blog posts and the offering of The Information Lab had dramatically increased. That content needed a better place to live and with the signing of our partnership with Alteryx the site needed to be just a little less Tableau focused and more based around our mission of helping people make sense of data.
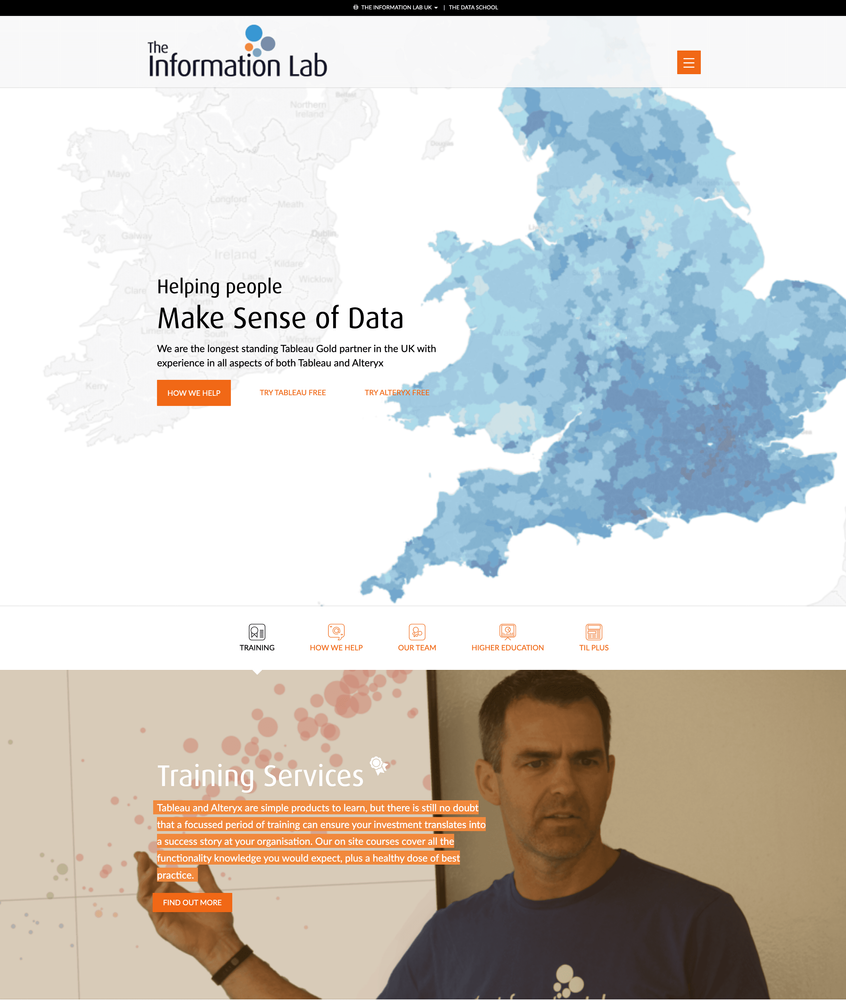
That site would go on to be translated into seven different languages as The Information Lab continued its expansion across Europe. It also started to present a problem for us in the UK as the rapid growth in need for Tableau and Alteryx content meant keeping our Wordpress servers in AWS online was becoming a full time job. Not only was the traffic big enough that we had to very quickly learn how to run a distributed environment but the site was also popular enough that it attracted the attention of Wordpress hackers who loved to try and mess with it at 10pm on a Friday evening. We would eventually switch our hosting to Pantheon who kept it running buttery smooth for the next 7 years.
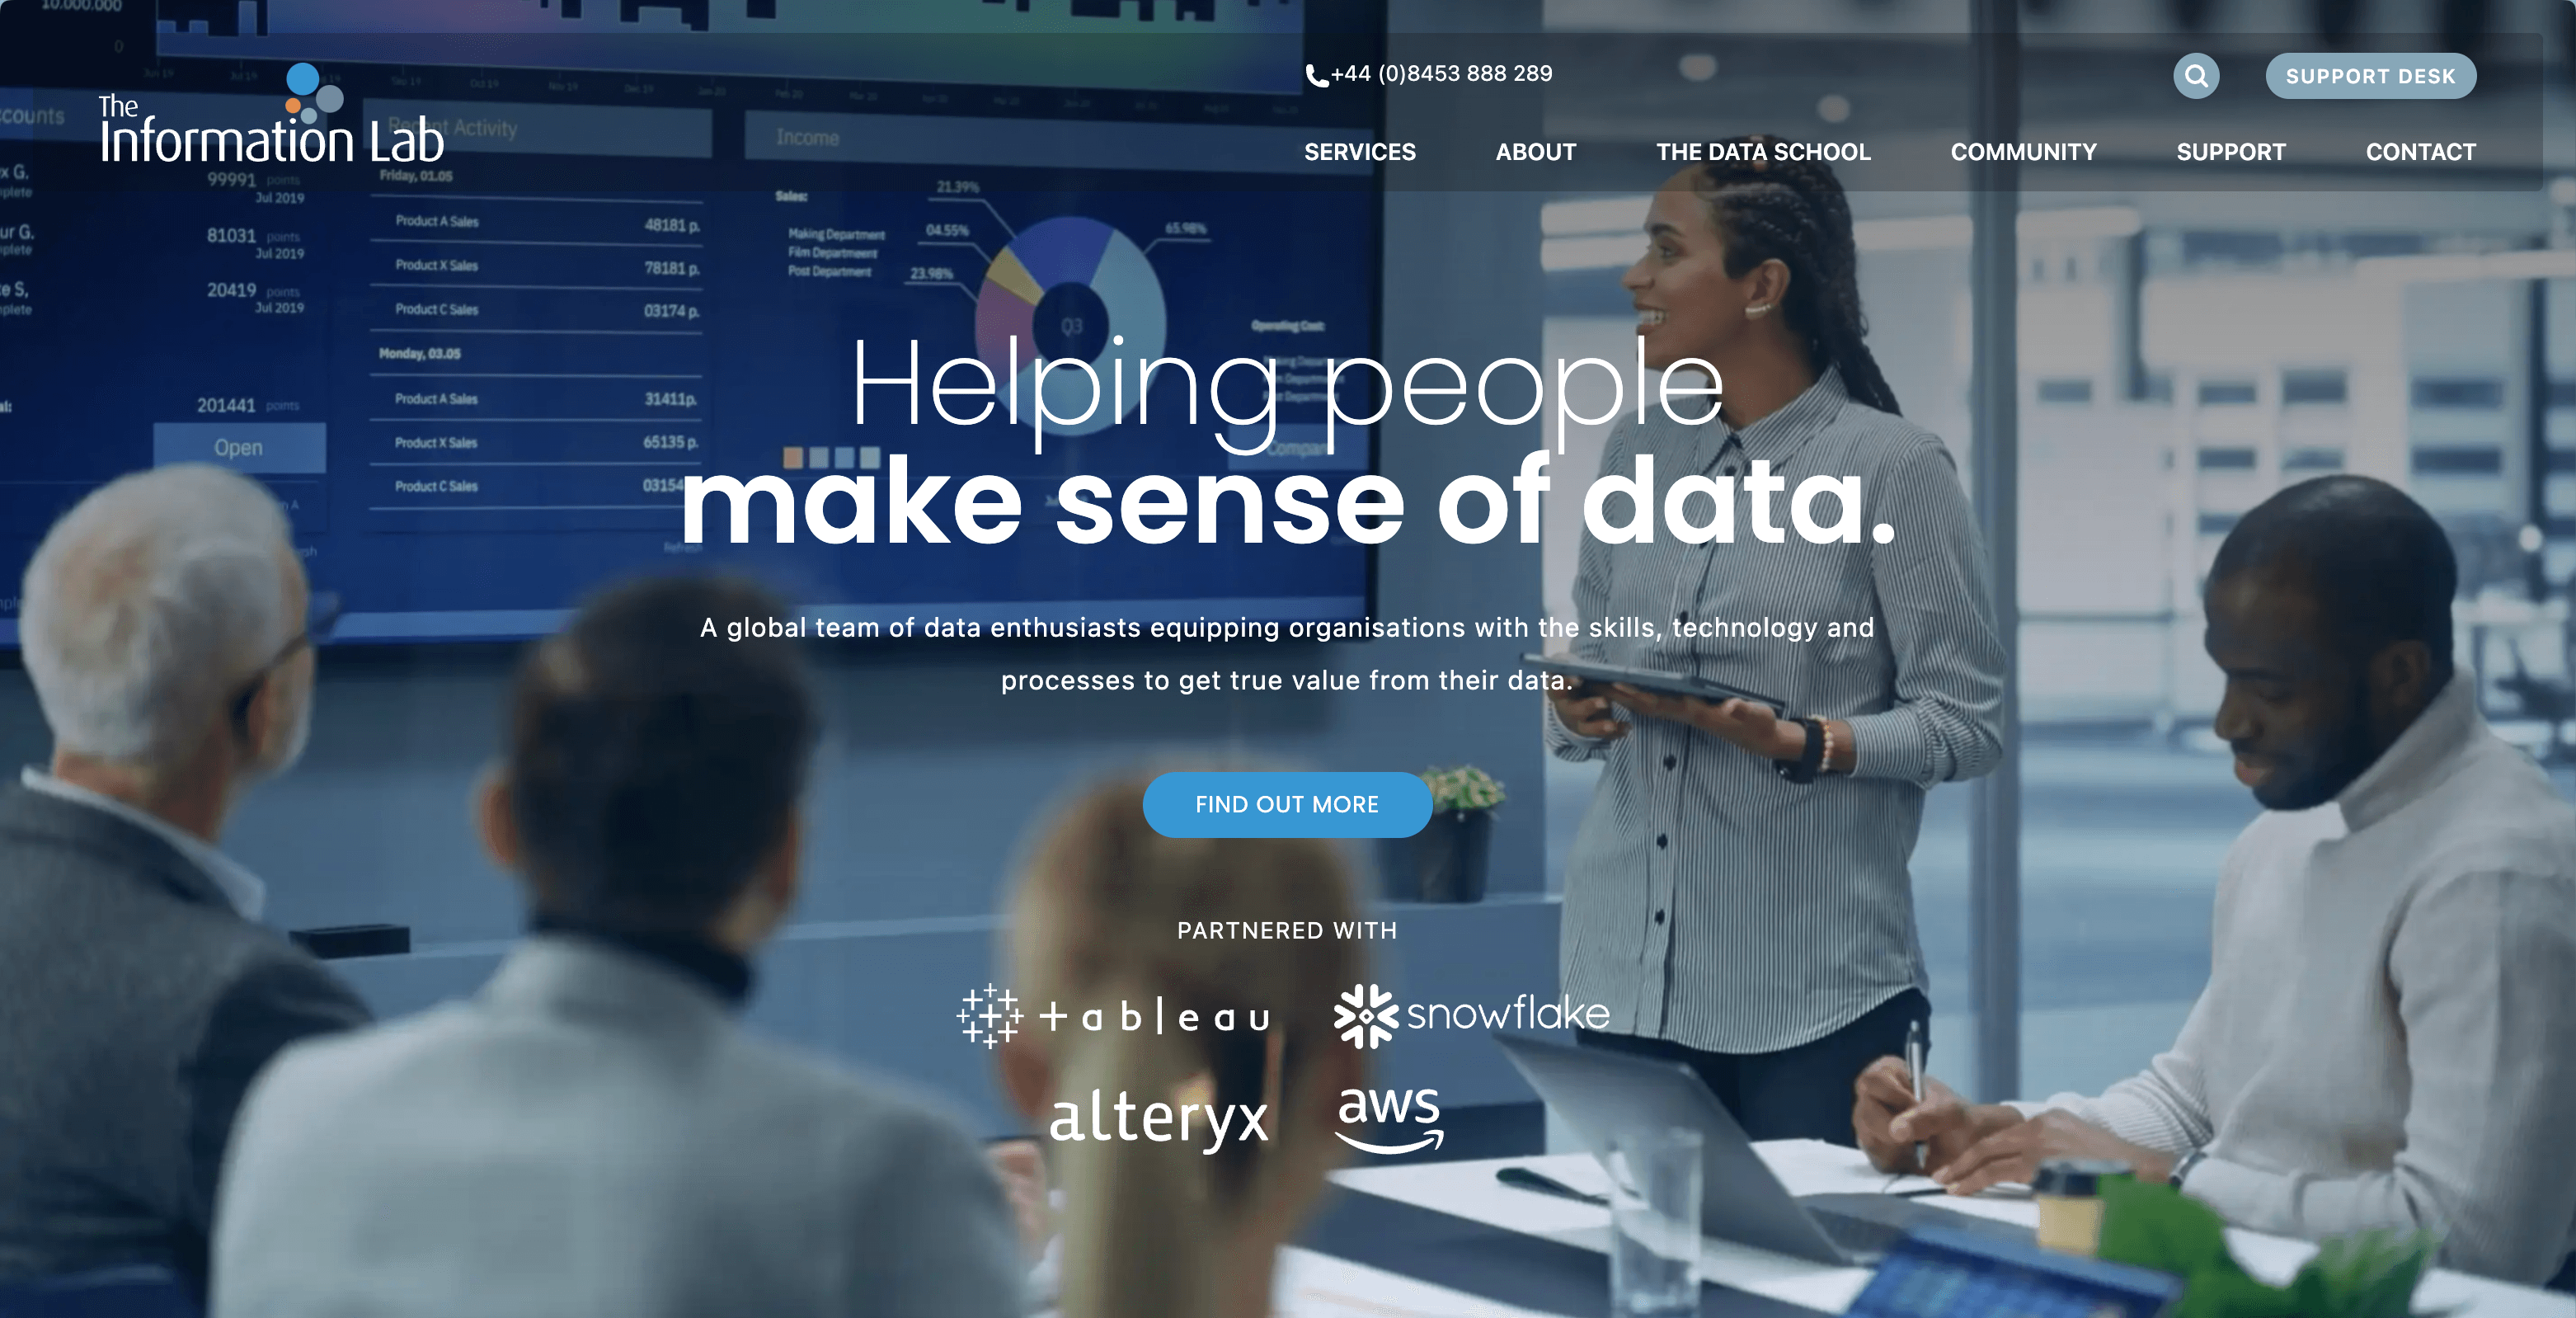
With this latest version we wanted to give the site a clean look which represents us after over a decade of being in business. We help all industries make sense of their data using the tools best suited for each individual client. We have added Snowflake and AWS to our key partnerships meaning storing your data or hosting your Tableau and Alteryx Servers with the watchful eye of infrastructure specialists is a benefit utilised by many of our customers. Our team has built the resources you need to get started analysing your data with some fantastic Tableau Accelerators. There are free training videos every team just starting with Tableau and Alteryx can make use of, an entire sub-site to inspire you with dashboards tailored to your industry and yes, the ever present and growing blog will always be there when you need it.
The introduction text may have evolved from v1, becoming: “We believe that companies of all sizes make better decisions when they have the information they need at their fingertips, allowing their people to feel empowered to apply their knowledge to a full compliment of analytics and analysis.”…but our mission is still the same to help people make sense of data.
In my next post I’ll geek out about the technology stack that underpins the new site, how Alteryx was invaluable to the migration process and potentially what you can look forward to as we execute the rest of our plan for this community resource.