

The summit offered a deep dive into the strategies shaping the future of data analytics, covering topics like data accessibility, dashboard optimisation, cloud solutions, workforce development, and AI integration.
This article compiles the key takeaways from the summit, offering organisations a practical guide to harnessing their full potential in today’s fast-changing business landscape.
Data Accessibility: Balancing Governance and Agility in the Modern Enterprise
The first topic was introduced by Craig Bloodworth, Chief Technology Officer at TIL, who discussed the growing challenge of data fragmentation across multiple applications. As organisations scale and adopt more agile processes, the need to centralise data while ensuring accessibility and security becomes critical.
Craig outlined the problem faced by many organisations—data disparity across department applications. “How can we keep down user access cost and complexity while giving everyone access to data held within these applications?” he asked, pointing out how inefficient it becomes as apps multiply. He recommended implementing a robust data extraction and storage solution that could handle data from hundreds of applications.
Craig’s solution starts with a clear framework of data engineering and analytics engineering, ensuring data is extracted, stored securely, and then transformed for analysis. He recommended tools like Airbyte for data integration, which can handle over 300 connectors, and Snowflake, a cloud-based platform ideal for cost-effective and secure data storage.
His personal recommendation of Snowflake stood out due to its cost efficiency and speed in loading large datasets. By utilising such tools, organisations can focus on data governance while maintaining agility—a vital aspect in today’s fast-paced digital environment.
Transforming Dashboards: From Static Reports to Dynamic Decision-Making Tools
In her session, Hannah Millington, Senior Consultant at TIL, discussed a common challenge faced by many organisations -"how can we transform dashboards from static and ineffective reports into dynamic decision-making tools?" - Her presentation focused on making dashboards more than just a visual representation of data, but rather an integral part of an organisation's strategic framework.
Hannah emphasised the importance of understanding the audience and the context in which a dashboard will be used. For instance, a CEO’s dashboard would prioritise high-level KPIs, while an operations manager would need more detailed, task-specific information. By recognising the audience and their needs, data analysts can ensure that the relevant data is presented most efficiently, facilitating informed decision-making.
Many organisations rely heavily on tables to display data, which can block important trends and insights. While tables can be useful in some contexts, they are not always the most effective way to highlight trends, anomalies, or patterns that can help decision-makers act quickly. She advised organisations to move beyond tables and use different visualisation techniques that can present the data in a clearer, and more intuitive way.
"Dashboards need to be designed to communicate insights in seconds, not minutes" she said, explaining that some dashboards can prevent users from extracting actionable insights. This is why interactivity is important. By incorporating features like filters, drill-downs, and interactive charts we can empower users to explore data much faster and more efficiently, allowing them to customise their view and their needs.
Moreover, Hannah stressed the importance of formatting and accessibility in dashboard design. This includes:
• Colour schemes be aware of colour blindness (which affects a significant portion of the population) by using contrast-friendly colors.
• Consistent layout and formatting to make your dashboards intuitive and easy to navigate. For example, using similar fonts, object spacing, and chart sizes helps users quickly understand the data presented.
Her presentation also focused on the performance optimisation of a dashboard, which is one important yet often overlooked aspect for data analysts. Slow-loading dashboards can be frustrating and may reduce the likelihood that the insights will be acted upon promptly. That's why optimising your data sources can be beneficial, this can reduce the number of complex queries, and limit the amount of unnecessary data to improve performance.
Finally, Hannah shared an example of a real-world dashboard redesign. The original dashboard was cluttered with too much data in table format, making it difficult to extract key insights.
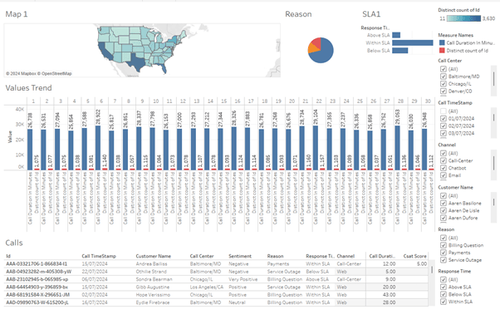
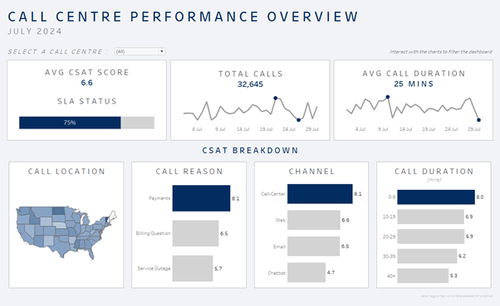
Our solution? Remove the excess information and simplify the visual layout by introducing more intuitive chart types. This new dashboard can help the users quickly see the key drivers of customer satisfaction, which can lead to better decisions about where to focus improvement efforts.
The takeaway from Hannah’s session is clear: "a well-designed dashboard is not just a tool for visualising data—it’s a strategic asset that can help companies drive faster and smarter decisions". Organisations can unlock their full potential just by focusing on the audience, improving interactivity and user experience, and ensuring that their dashboards are both accessible and performant.
Harnessing the Cloud: Scalability and Availability in Analytics
Nick Jastrzebski followed with a discussion on how cloud technologies can scale analytics capabilities for modern organisations. He began by addressing the value of the cloud, describing it as “borrowing computers from someone else,” while noting the availability and scalability this offers.
Nick elaborated on the three levels of cloud services:
Infrastructure as a Service: Offering maximum control but requiring more hands-on management.
Example: Tableau Server in the Cloud is an example of IaaS, where businesses manage their analytics platforms but still benefit from the scalability and flexibility of the cloud.
Platform as a Service: Ideal for companies that need a balance of control and simplicity.
Example: services like AWS Redshift, Google BigQuery, and Microsoft Azure SQL fall into this category. These platforms allow companies to manage data storage and queries without worrying about hardware or operating systems.
Software as a Service: The most hands-off approach, where the provider handles all infrastructure, security, and updates.
Example: solutions like Tableau Cloud and Snowflake, that help businesses conduct analytics directly in the cloud without worrying about infrastructure or maintenance.
Nick also discussed the cost advantages of cloud platforms. "With the cloud, you only pay for what you use," Nick explained, highlighting the scalability and elasticity of cloud-based analytics. This flexibility is critical for growing companies that want to avoid the hefty upfront costs of on-premises infrastructure.
Cloud migration may require careful planning. He pointed out three key things that organisations need to consider:
Migration Costs: Companies must prepare for initial investments, including training and security updates.
Data Interdependencies: It’s important to understand how different data sources and applications interact before migrating.
Staging Migrations: Migrating in phases minimises disruption and allows testing and optimisation at each stage.
"Will Tableau Desktop survive in the cloud-driven future?" while Tableau Cloud is gaining popularity for its scalability and ease of use, Tableau Desktop still serves companies with on-premise needs. SaaS solutions like Tableau Cloud can be used to simplify infrastructure management, but for industries with strict compliance or geographical constraints, Tableau Desktop or Server remains essential.
Cloud-based solutions are the future, but on-premise options will still be relevant for certain industries requiring full data control.
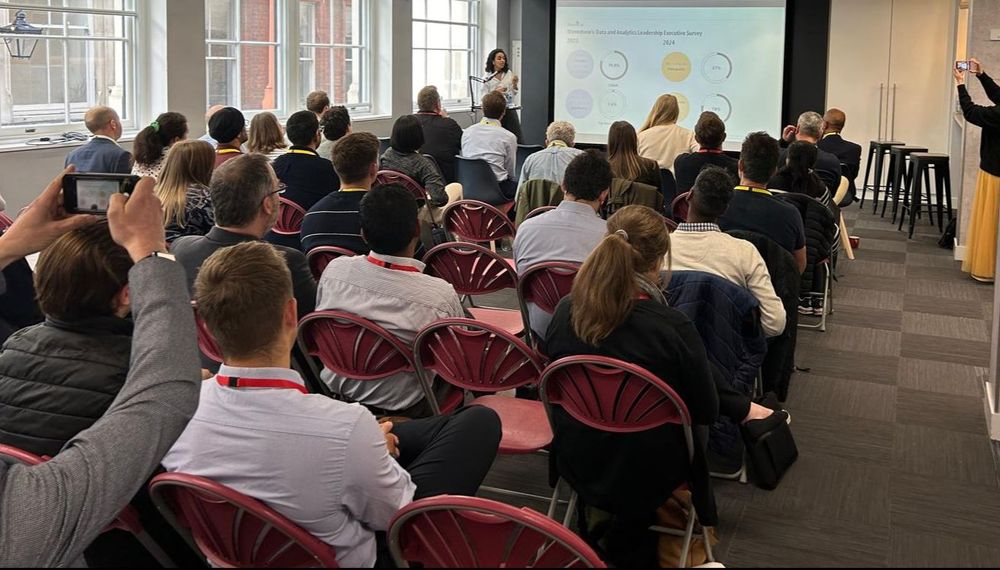
Cultivating a Data-Savvy Workforce: Strategies for Building a Data-Driven Culture
Ruth Amarteifio shifted the focus to the human element in data-driven organisations.
Building a data culture is important for unlocking the full potential of data within any organisation. She started with a thought-provoking question: “Can you change culture from within?”
The answer lies in enabling teams with the right tools and knowledge. She introduced a three-pillar strategy for building a data-savvy workforce:
Self-paced learning using resources like The Information Lab’s Learning Hub, TIL Youtube channel, or TIL blogs.
Community-based learning fosters collaboration and shared knowledge. The Information Lab offers both remote and in-person training, providing employees with a solid foundation in data skills.
On-demand support through our programs like "Doctor Sessions" or “Focused Support” that can provide immediate assistance for data-related queries.
Ruth highlighted a key challenge: "how do organisations know when they have reached a good level of data enablement?" Her guidance was to start small, evaluate often, and establish data literacy programs across departments.
Her talk was filled with practical examples, showing that companies that invest in data training programs not only improve their operational efficiency, but also inspire greater employee engagement resulting in a better approach to problem-solving.
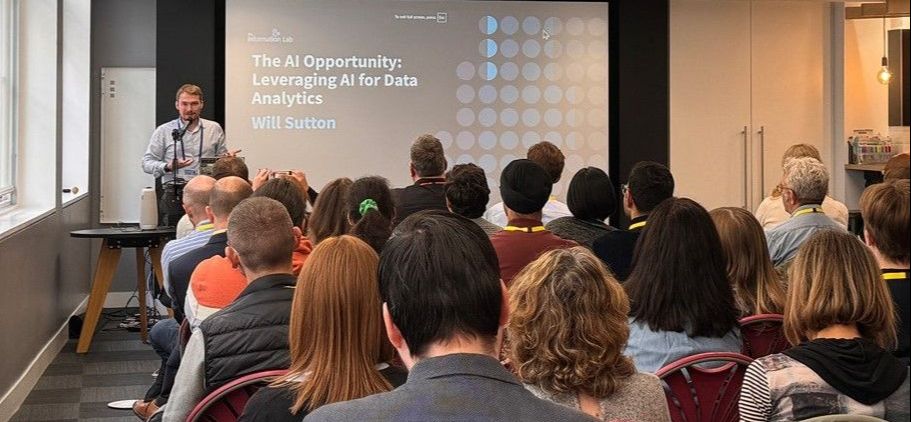
AI in Analytics: Opportunities, Limitations, and Practical Applications
The conference ended with Will Sutton, who explored the role of AI in modern data analytics. Will’s session was both informative and cautionary, as he discussed the potential and limitations of AI in business contexts.
He began by sharing a personal story about a recent challenge where he built a project with AI tools like ChatGPT in less than a week. However, when the final projects were compared, Will noticed that the projects done by the people without help from AI outperformed his AI-generated work.
His conclusion? "AI won’t replace data analysts anytime soon." This echoed findings from a Databricks study that showed 85% of AI projects fail to reach production due to poor integration and over-reliance on AI capabilities.
Will also demonstrated how AI can improve the work of data analysts by automating repetitive tasks and providing deeper insights through tools like Tableau Pulse and Einstein Co-pilot. These tools, when used correctly, can enhance decision-making by offering AI-powered insights directly within business intelligence platforms.
Will advised organisations to start small and ensure proper integration of AI models into their existing workflows. AI needs to be monitored carefully to avoid the pitfalls of over-reliance on machine-generated decision
Key Takeaways
The Data Summit 2024 was more than just a showcase of new tools and trends—it was an opportunity for companies to learn more and become up-to-date with new features.
As we look ahead, the future certainly belongs to these organisations that focus on integrating technology, data literacy, and AI into their operations. The road to becoming a data-driven organisation is long, but as the speakers at the summit demonstrated, the rewards are worth the effort.
Stay Ahead in the Data Game: Subscribe to Our Newsletter
Join The Information Lab's exclusive newsletter for cutting-edge insights, expert tips, and early access to upcoming events that will supercharge your organisation's data strategy. Don't miss out on the latest trends and tools driving data excellence—Subscribe today!