Following my time at the Tableau Conference, I wanted to share a few handy tips and tricks in Tableau Desktop. First up: hidden functions.
Let’s dive into what “hidden functions” actually are and take a look at how to use RANDOM(), LEAST()/GREATEST(), and SYS_NUMBIN.
What Are Hidden Functions?
Hidden functions in Tableau are built-in calculations that don’t appear in the autocomplete list or documentation, but they will work if you type them manually. That means you have to know they exist to use them
Let’s take a look at our three examples.
Give your data some room to breathe with RANDOM()
I was already familiar with this one before the conference, but it still deserves a mention. RANDOM() generates a random number between 0 and 1 for each mark in the view. It’s especially helpful when you need to break up overlapping marks or create jitter plots like the example below.
How to use it:
Just type RANDOM() into a calculated field. Tableau won’t auto-complete it, but it does work.
You can use it as:
A measure (e.g., AVG(RANDOM()), SUM(RANDOM()))
A dimension
An attribute
Here, in the chart below, I could do with some spacing:
Once dragged onto your view (for example, onto the Columns or Rows shelf), an axis will appear, and each mark will get a random value.
Bonus Tip: I like to fx my axis between e.g. -0.2 and 1.2 to create some breathing room around the data - this helps to visually spread things out without going overboard.
The random values regenerate every time you interact with the viz, like when you add something to the Tooltip or change colour encoding. So, if you’re using a dual axis, make sure you have the same things on each card if you want your marks to align.
Using LEAST() and GREATEST() to Compare Across Measures
Discovered this function thanks to the brilliant Flerlage Twins, and it provides a solution for a common problem.
The Problem
Let’s say you’ve got data with scores for each round in separate columns, e.g Round 1, Round 2, Round 3, and so on. You want to find the minimum or maximum score across those rounds for each player.
Traditionally, this means using multiple IF statements and/or wrestling with MAX() and MIN(), which only work on two inputs at a time. It’s doable, but clunky.
The Solution
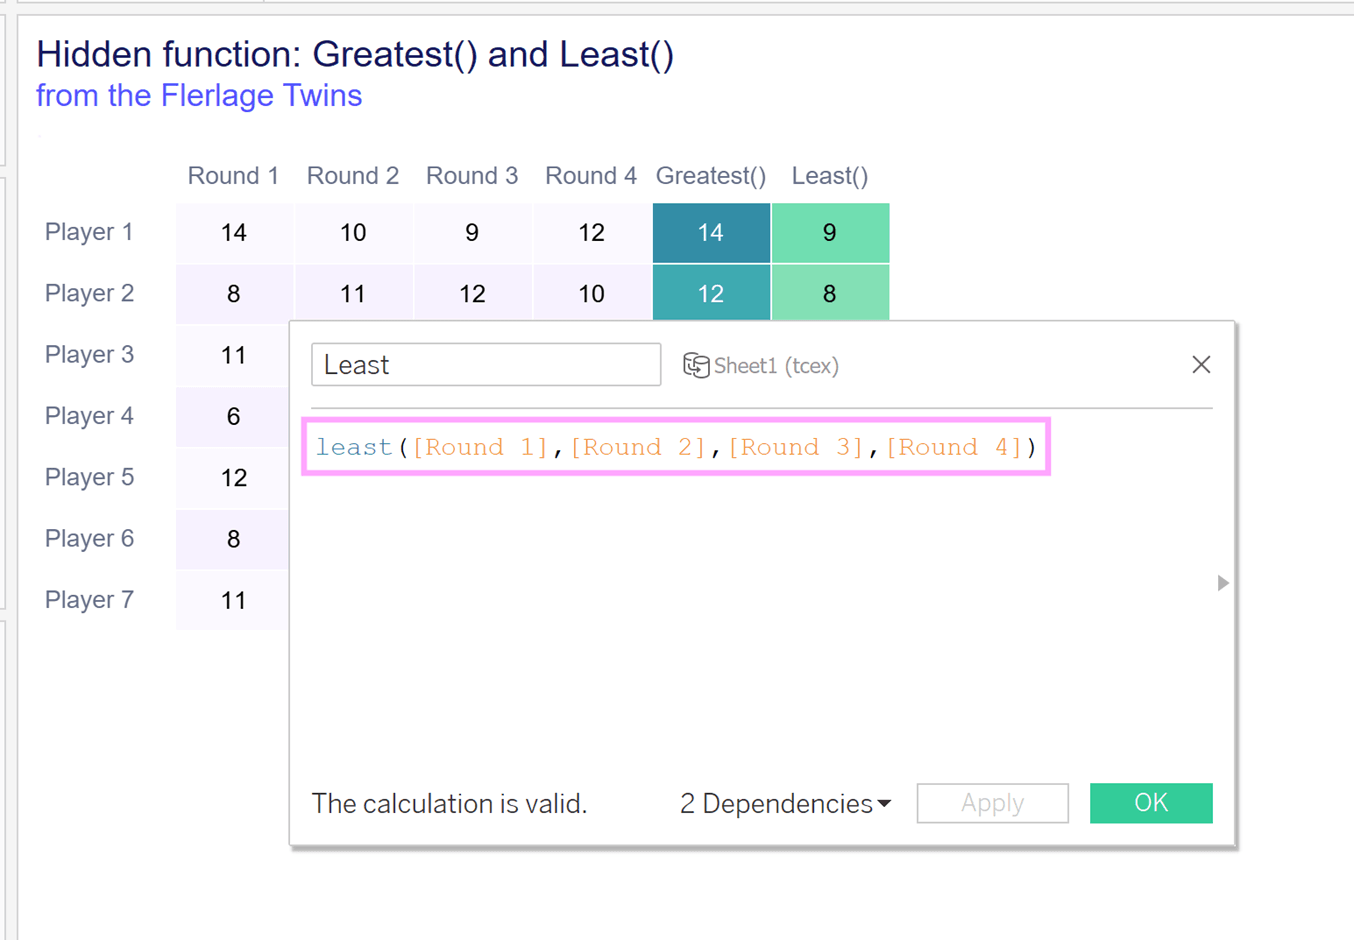
LEAST() — returns the smallest value from a list
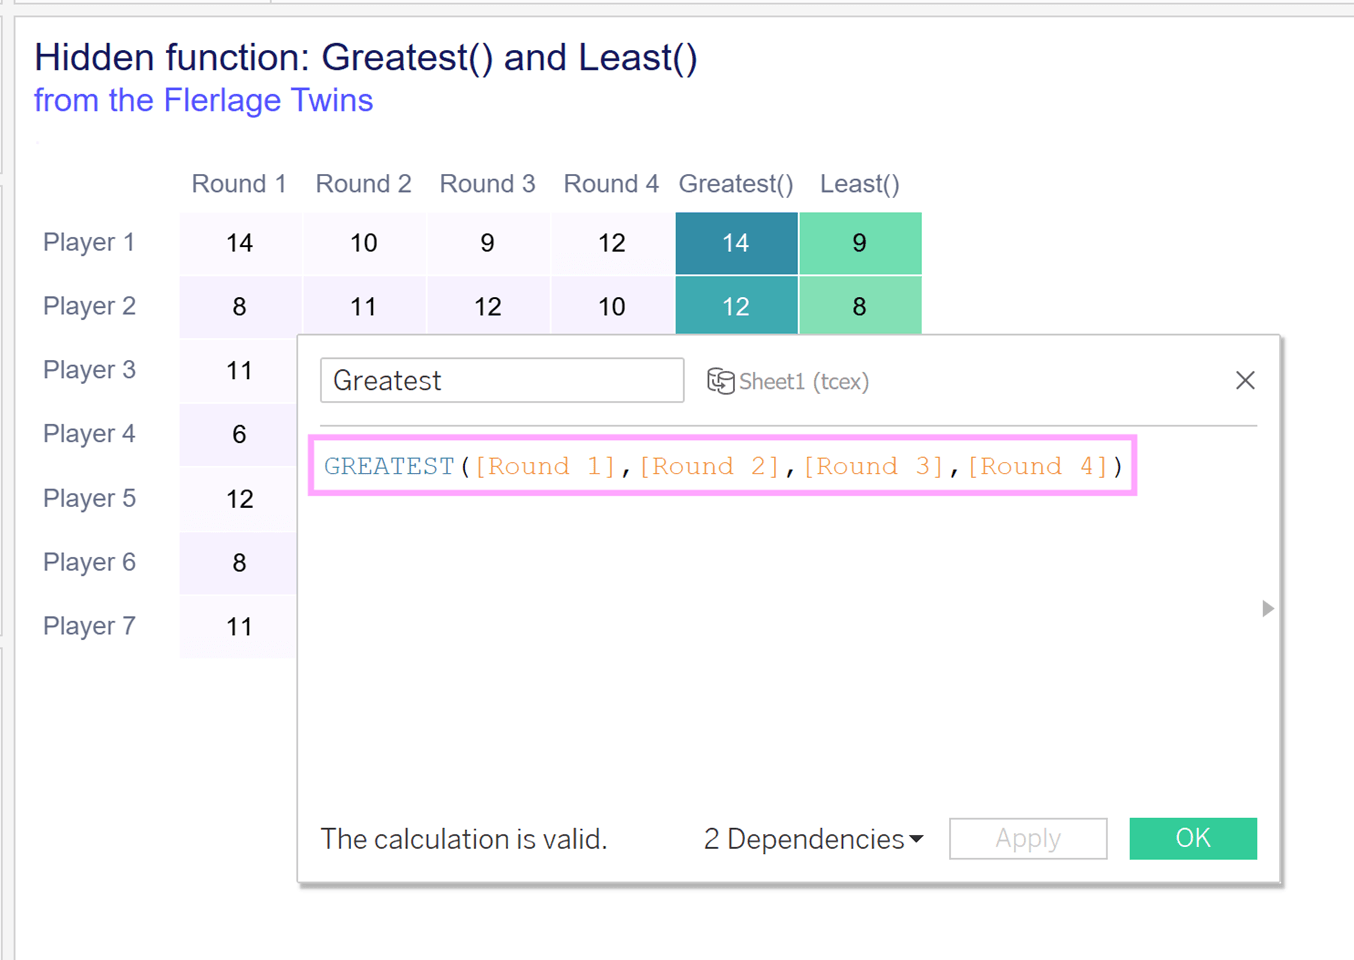
GREATEST() — returns the largest value from a list
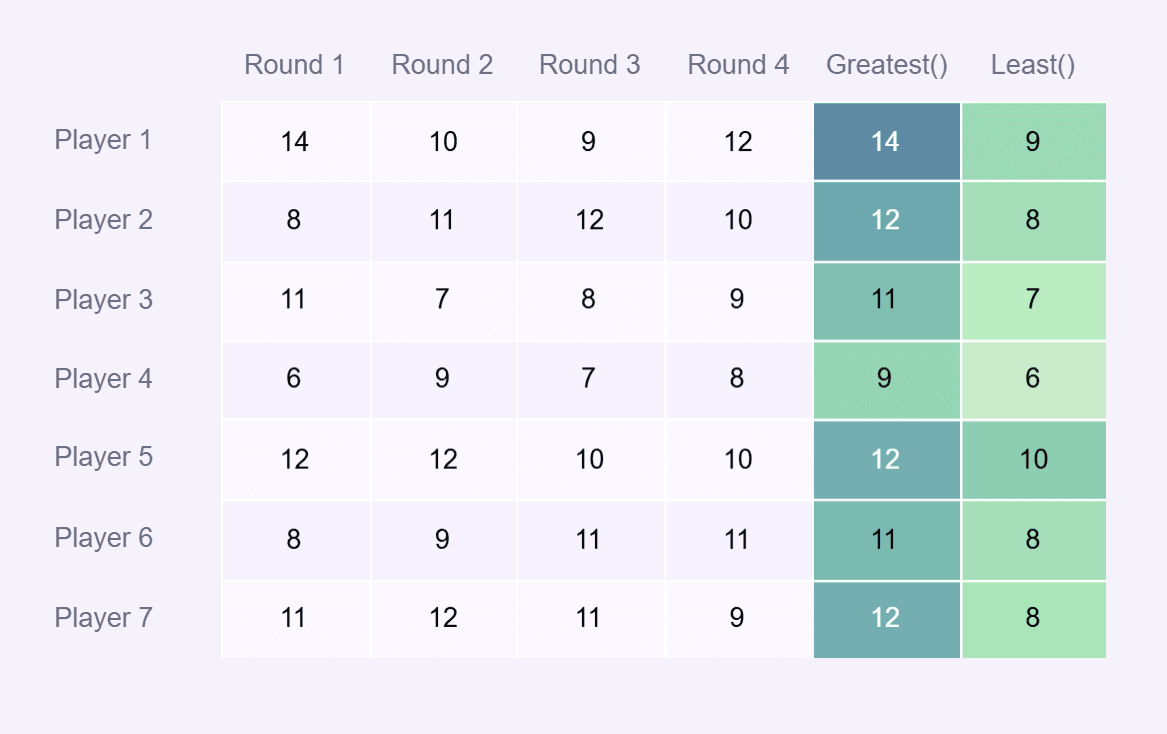
I had a dataset with 7 players and their scores across 4 rounds, each round in its own column (i.e. separate measures). I wanted to find the highest and lowest score per player across all rounds.
Here’s what I did:
LEAST([Round 1], [Round 2], [Round 3], [Round 4])
GREATEST([Round 1], [Round 2], [Round 3], [Round 4])
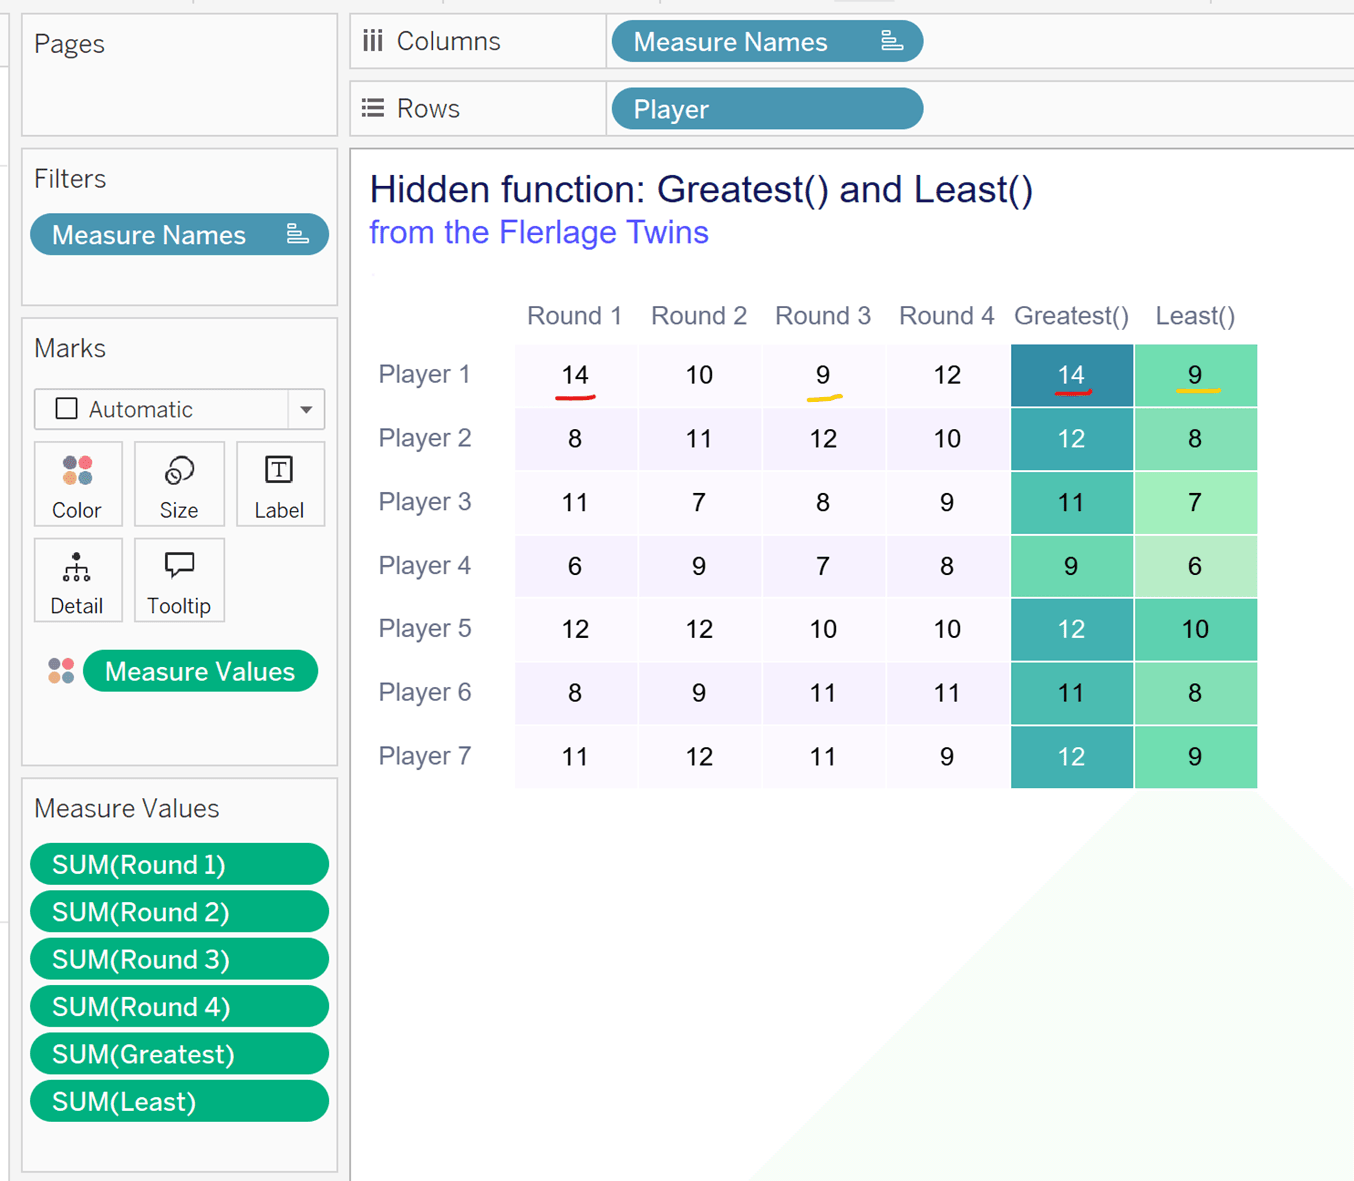
Add these new calculated fields to your view using Measure Names and Measure Values, and you're done. It's a great way to get quick insights into min/max values across multiple columns without cluttering your workbook.
SYS_NUMBIN(): Build Custom Bins in Calculation
This one was also new to me, which I discovered via Jeffrey Shafer.
You’ve probably tried creating bins using Tableau’s native “Bins” functionality, only to find a few shortfalls of using these, such as being unable to add reference lines.
SYS_NUMBIN() lets you create your own bins within a calculation.. There are a few other techniques out there to create but this is a very simple one.
How to use it:
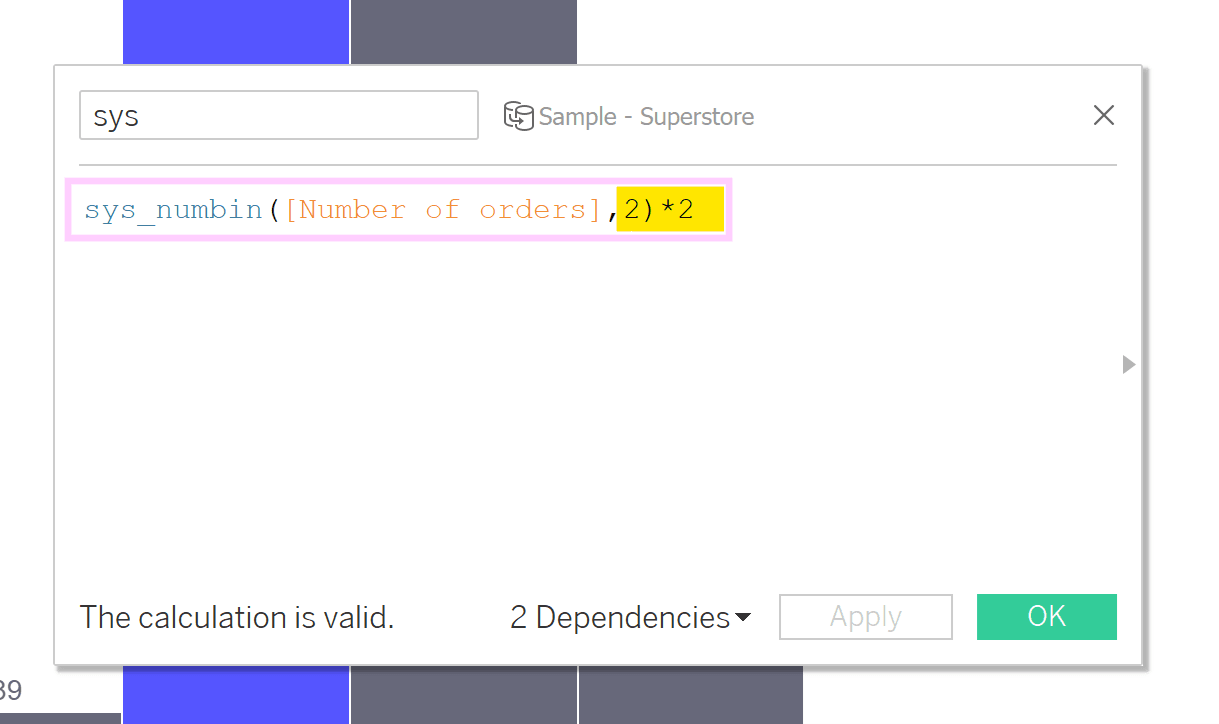
SYS_NUMBIN([Number of Orders], 10) * 10
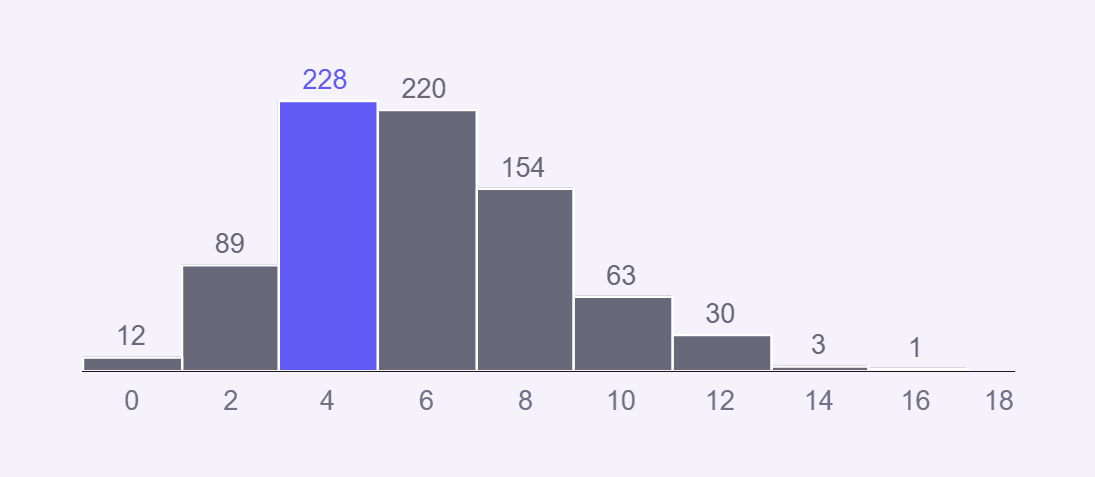
This gives you bins in increments of 10. Swap out the ‘10’ for whatever value you prefer. I used increments of 2 to create the following histogram.
After you've created your calculated field, right click on it in the data pane, convert it into a dimension, and you can use this in your view as a discrete or continuous field.
It’s a quick way to generate repeatable, clean groupings, without being stuck with some of the limitations of the native bin feature.
To see these tips in action, you can download my TC dashboard on Tableau Public.